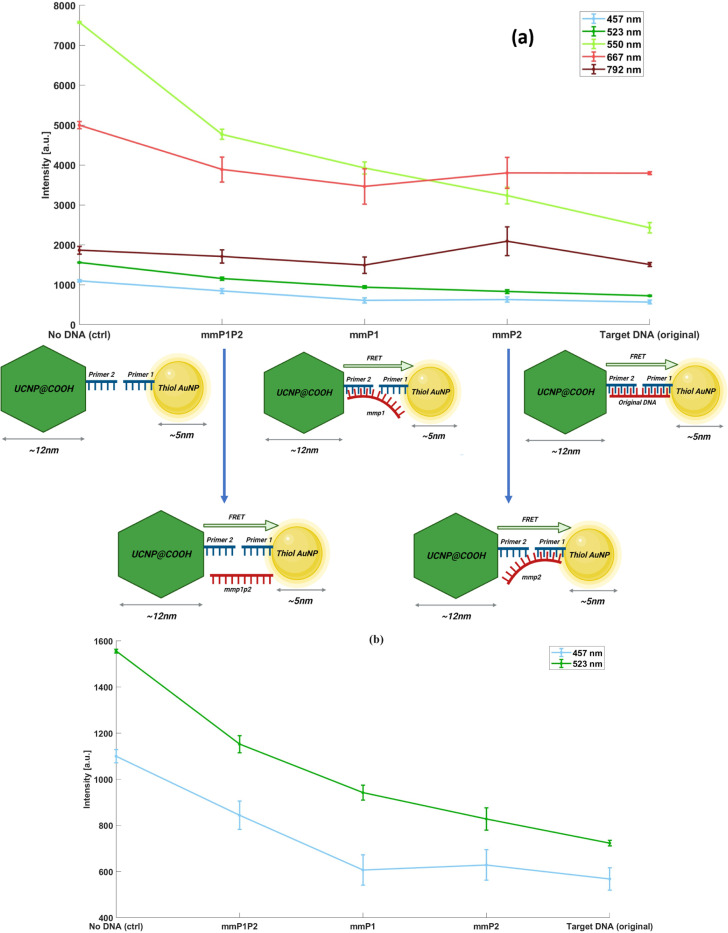
Figure 3.
Results of the miss-matched DNA experiment for determination of specificity. A) shows the average intensity at major UCNP peaks for each type of miss-match DNA sequence. The target DNA shows the maximum quenching compared to the negative control, measured at 64.4 %, while the mmP1P2, where the 12 miss-match bases are on the UCNP side, and 12 miss-match bases are on the AuNp side as well, shows only 39.3 %. (b) shows the zoomed-in view for 523 nm and 457 nm results, both showing much lower sensitivity compared to 550 nm.

