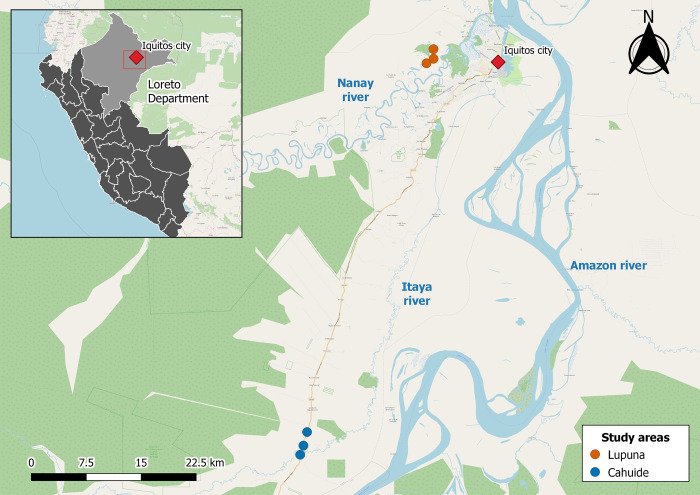
Fig 1. Map of Study Areas.
The collection sites in the Lupuna area (Santa Rita, San José de Lupuna, and San Pedro) are denoted by orange circles. Likewise, collection sites in the Cahuide area (Habana, Doce de Abril, and Cahuide village) are denoted by blue circles. The city of Iquitos and the rivers commonly used for transportation are highlighted in red and blue, respectively. The map was generated using QGIS 3.16 (QGIS Development Team, 2023. QGIS Geographic Information System. Open-Source Geospatial Foundation Project. http://www.qgis.org/) and utilizes layers from OpenStreetMap (http://www.openstreetmap.org/), which is licensed under the Open Data Commons Open Database License (ODbL). Shapefiles are freely available on the Peruvian National Institute of Statistics and Informatics (INEI) website (https://ide.inei.gob.pe/).

