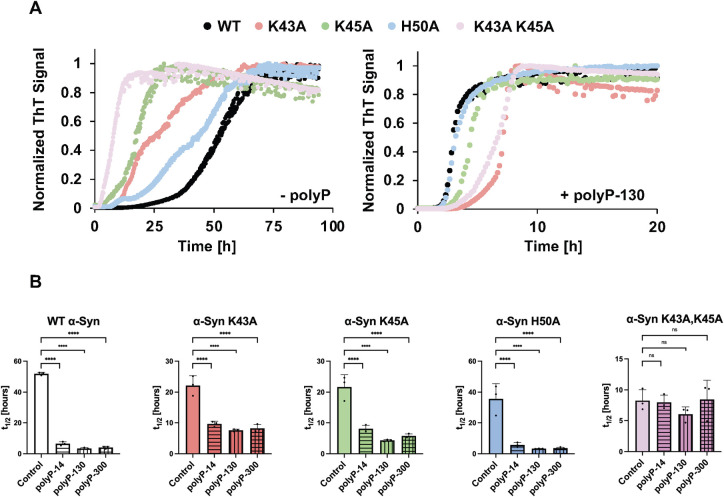
Fig 2. Effect of polyP on the kinetics of WT and mutant α-Syn fibril formation.
(A) ThT fluorescence curves of 100 μM α-Syn wild-type and mutant proteins in the absence (left panel) or presence of 500 μM polyP-130 (in Pi-units) in 40 mM KPi, 50 mM KCl (pH 7.5). n = 3 and a representative graph is shown. (B) Respective half-lives (t1/2) of fibril formation. The mean of 3 experiments ±SD is shown. Statistical analysis was prepared with one-way ANOVA (ns P-value >0.05, **** P-value <0.0001) comparing each polyP sample to the control sample (absence of polyP). The underlying data can be found in Mendeley (see data statement for details).

