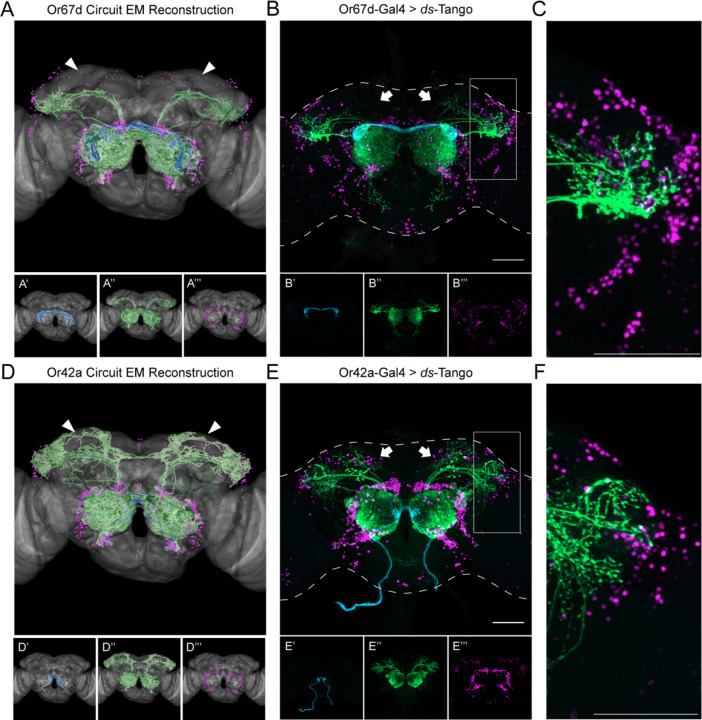
Figure 3. Specificity of ds-Tango.
(A) Or67d Circuit EM reconstruction projected on a template brain (gray) reveals the OSNs (cyan, shown in A’), LNs and OPNs (green, shown in A’’), and the nuclei of third-order neurons (magenta, shown in A’’’).
(B) Driving ds-Tango using Or67d-Gal4 labels Or67d-OSNs (cyan, shown in B’), their monosynaptic partner LNs and OPNs (green, shown in B’’), and the nuclei of their disynaptic connections (magenta, shown in B’’’).
(C) Higher magnification image of the gray inset in (B), depicting the lateral horn.
(D) Or42a Circuit EM reconstruction projected on a template brain (gray) reveals the OSNs (cyan, shown in D’), LNs and OPNs (green, shown in D’’), and the nuclei of third-order neurons (magenta, shown in D’’’).
(E) Driving ds-Tango using Or42a-Gal4 labels Or42a-OSNs (cyan, shown in E’), their monosynaptic partners LNs and OPNs (green, shown in E’’), and the nuclei of their disynaptic connections (magenta, shown in E’’’).
(F) Higher magnification image of the gray inset in (E), depicting the lateral horn.
Arrowheads in A and D highlight the absence and presence of third-order Kenyon cells in the MB, respectively. Arrows in B and E highlight the absence and presence of third-order Kenyon cells in the MB, respectively. Maximum intensity Z-stack projection of whole-mount brains are shown in B and E. Dashed lines in B and E depict the approximate outline of the fly brains. Scale bars = 50 μm.

