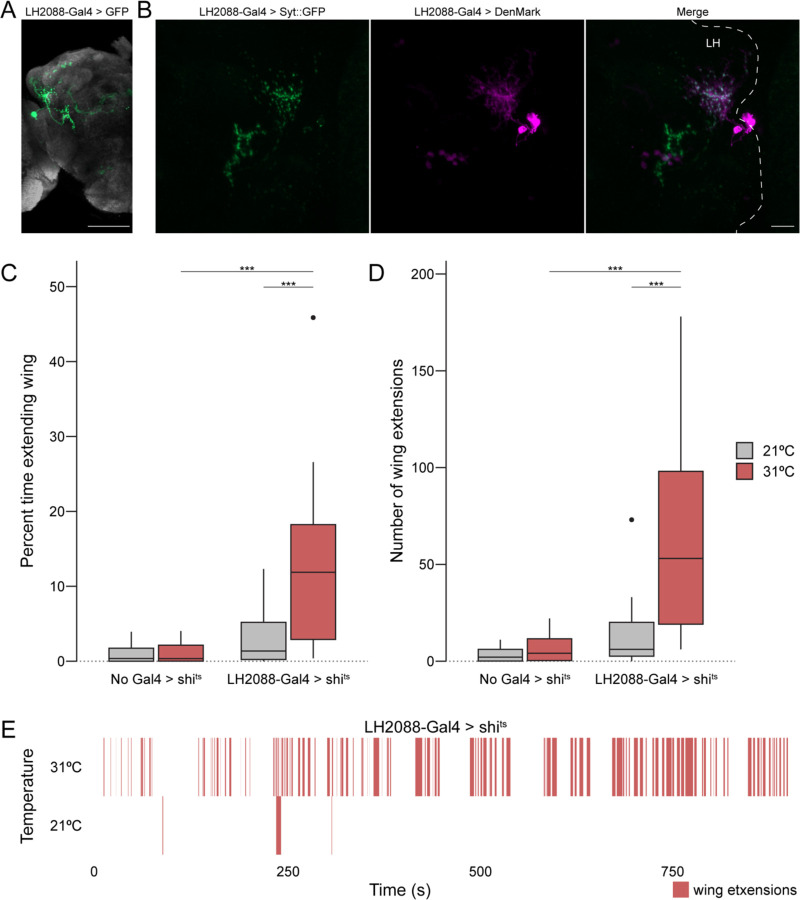
Figure 6. Anatomical and functional analysis of the Maiandros neurons.
(A) Expression pattern of the LH2088-Gal4 driver line. LH2088-Gal4 drives UAS-GFP (green). The Maiandros neurons are clearly labeled along with minimal background in the MB. Neuropil counterstain is shown in grey.
(B) Locations of the Maiandros neuron axons and dendrites. LH2088-Gal4 drives synaptic vesicle marker Syt::GFP (green) and dendritic marker DenMark (magenta). Axons and dendrites are intermixed in the LH while ventral neurites in the AVLP are primarily axons. Dashed lines indicate the outline of the central brain. LH indicates lateral horn.
(C) Quantification of unilateral wing extension as indicator of attempted courtship when each experimental male fly is paired with a single naïve WT male. Boxplot depicting the percent of total trial time (15 min) that experimental male flies extended one wing during thermogenetic silencing using shits. Silencing of the Maiandros neurons in male flies tested at the restrictive temperature of 31°C results in increased time spent with one wing extended relative to genetic controls and to experimental flies tested at the permissive temperature of 21°C.
(D) Quantification of unilateral wing extension as indicator of attempted courtship when each experimental male fly is paired with a single naïve WT male. Boxplot depicting the total number of unilateral wing extensions exhibited by experimental male flies during thermogenetic silencing using shits. Silencing of the Maiandros neurons in male flies tested at the restrictive temperature of 31°C results in increases in total number of wing extensions relative to genetic controls and to experimental flies tested at the permissive temperature of 21°C.
(E) Rasterplot depicting bouts of unilateral wing extensions over time for representative trials of male flies bearing the LH2088-Gal4 and UAS-shits alleles in the thermogenetic silencing assay at the permissive temperature of 21°C and the restrictive temperature of 31°C. Unilateral wing extensions are sparse at 21°C but abundant throughout the 31°C trial.
Maximum intensity Z-stack projection of whole-mount brains are shown in (A) and (B). Scale bars, 50μm in (A) and 10μm in (B).

