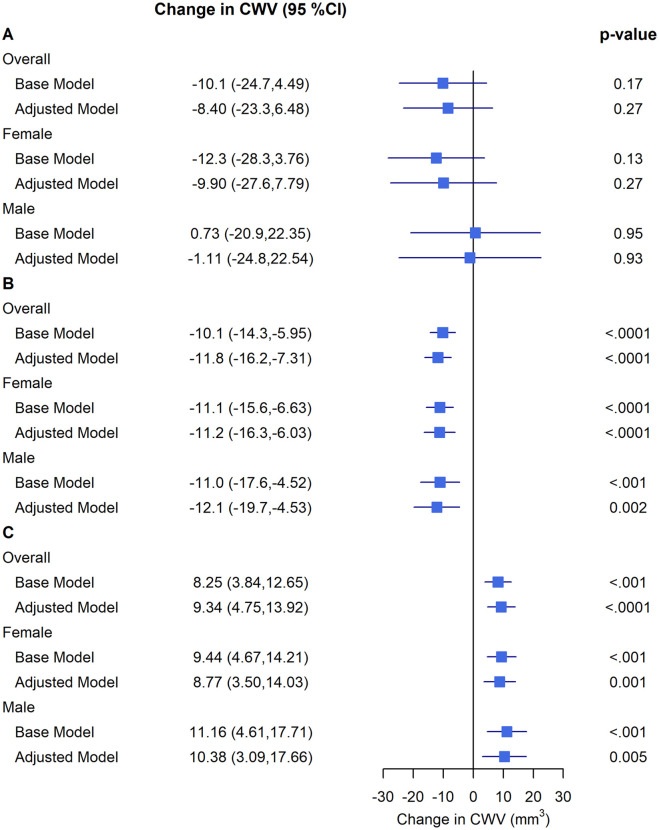
Fig 1. Associations of 5-year pollutant exposures with subclinical atherosclerosis as measured by carotid wall volume (CWV).
Presented data are carotid wall volume adjusted estimates (95% CI) per (A) 5 μg/m3 increase for PM2.5, (B) 5 ppb increase for NO2, and (C) 3 ppb increase for O3, from a linear mixed model with centre modelled as a random intercept. The base model has no fixed effects; the adjusted model includes age, (sex), ethnicity, INTERHEART risk score, education, workplace location, walkability categories, material factor score, and social factor score.

