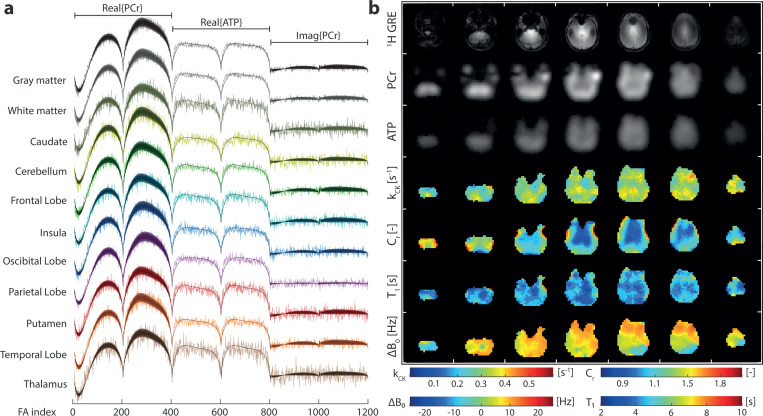
Fig. 2.
(a) Examples of measured signal evolutions and their matched dictionary entries of different ROIs. (b) In vivo brain images of the same participant including reference 1H GRE images, the 31P bSSFP-type images (sum along FA index) for PCr and ATP, the , , and maps. Colour map ranges are set according to the dictionary limits for , and . colour range limits were set to increase the visibility of gray and white matter differences.

