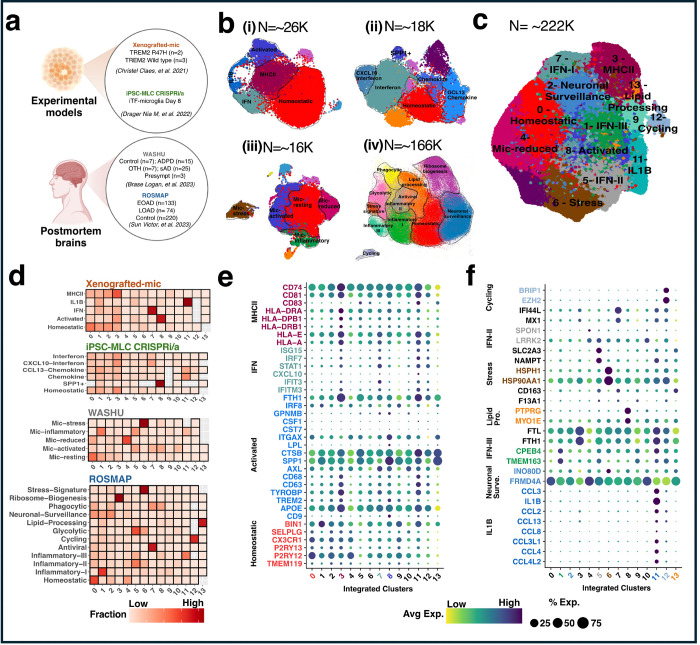
Figure 1. Integration of Single-cell transcriptomics datasets.
a Diagram depicting the single-cell transcriptomics dataset utilized. b Highlighted transcriptional states selected from each single-cell transcriptomics dataset, demarcated with dotted lines. c UMAP plot showing 14 distinct integrated clusters labeled 0–13, comprising a total of 222,822 cells. d Quantification of individual cell state contributions to the integrated transcriptional state. e-f) Gene expression analysis within each transcriptional state, referencing studies by Yun Chen et al. (2021) and Sun et al. (2023). Cluster numbers and gene names are highlighted with the same color code to indicate enrichment.

