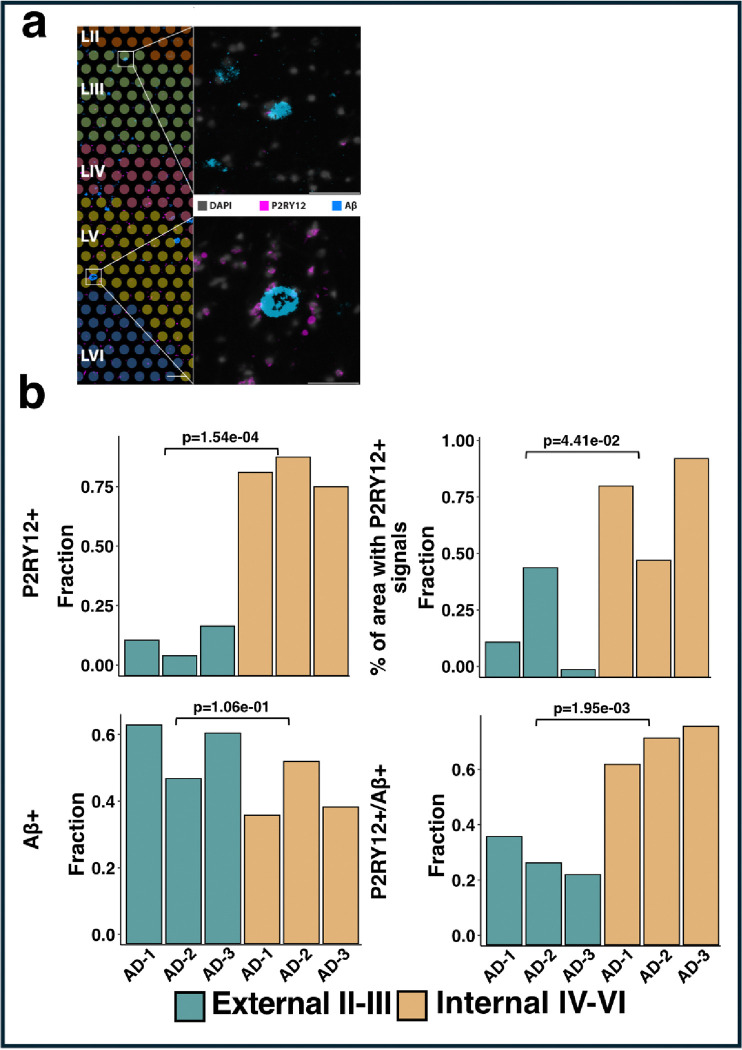
Figure 4. Immunostaining of P2RY12 gene across AD samples.
a Immunofluorescence (IF) staining of P2RY12 and Aβ on adjacent sections (10 μm interval) from the middle temporal gyrus of a human AD sample was aligned with 10x Genomics Visium spots (color coded) at layers II-VI (Chen et al. ANC, 2022). High-mag images of IF staining of nuclei (DAPI, grey), homeostatic microglia (P2RY12, magenta) and AD pathological hallmark (Aβ plaques, blue) in external layers II-III (top panel) and internal layers IV-VI (bottom panel) were selected. Scale bar, 200 μm for layers II-VI image, 50 μm for external and internal high-mag images. b Bar plots comparing the counts of IF stained P2RY12+ cells and Aβ+ spots distribution in cortical layers II-III and IV-VI across all AD samples. Upper Left: P2RY12+ count, Upper Right: Aβ+ spots, Lower Left: P2RY12+/Aβ+ overlapped, Lower Right: P2RY12+/Aβ− spots. To compare the P2RY12+ count or/and Aβ+/− spots between layers II-III and IV-VI for all AD samples, counts in each group were normalized with the total number in layers II-VI. p-values were calculated using a two-sided t-test. Exact p-values can be found in the Source Data file.

