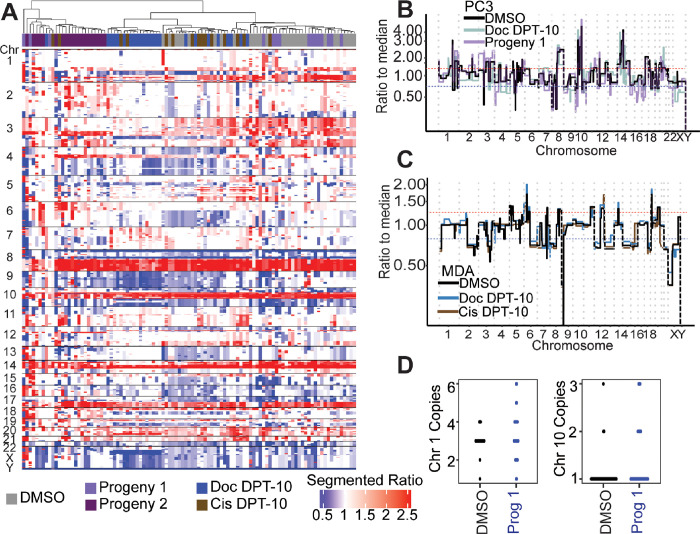
Figure 3.
Genomics of PC3 DMSO control, docetaxel treated cells, and docetaxel large cell progeny-1. (A) Segmented copy number ratios for PC3 conditions. Ratio of 1 (white) indicates copy number neutral respective to the entire genome. (B) Representative PC3 DMSO, Doc D10, and Progeny-1 copy number ratio profiles. (C) Representative MDA-MB-231 DMSO control, Doc D10, and Cis D10 copy number ratio profiles. (D) FISH for PC3 DMSO control and progeny-1 cells for centromere of chromosome 1 (ploidy = 3) and chromosome 10 (ploidy = 1).

