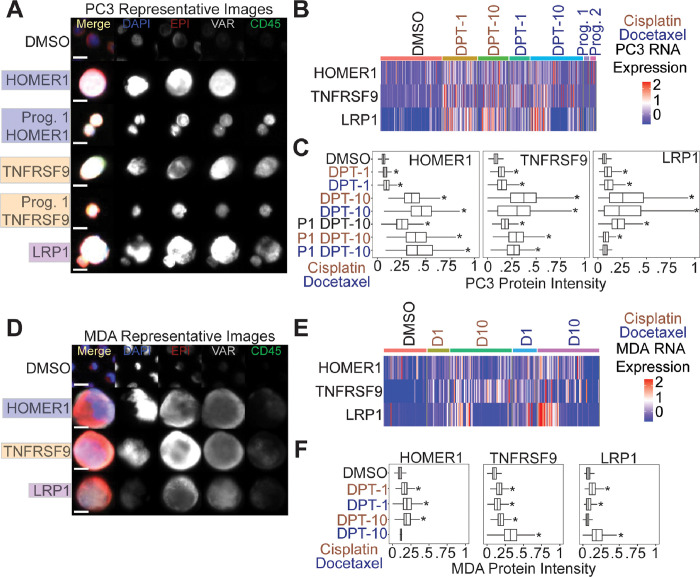
Figure 5.
HOMER1, TNFRSF9, and LRP1 are putative markers of chemotherapy resistance. (A) Representative PC3 images of putative marker genes stain in the VAR (4th) channel. DMSO control cells were stained with HOMER1 and were negative. (B) RNA expression for each marker for all PC3 cells. (C) Immunofluorescence quantification for PC3 cells stained with tested markers. (D) Representative MDA-MB-231 images of putative marker genes stained in the VAR (4th) channel. DMSO control cells were stained with HOMER1 and were negative. (E) RNA expression for each marker for all MDA-MB-231 cells. (F) Immunofluorescence quantification for MDA-MB-231 cells stained with tested markers.

