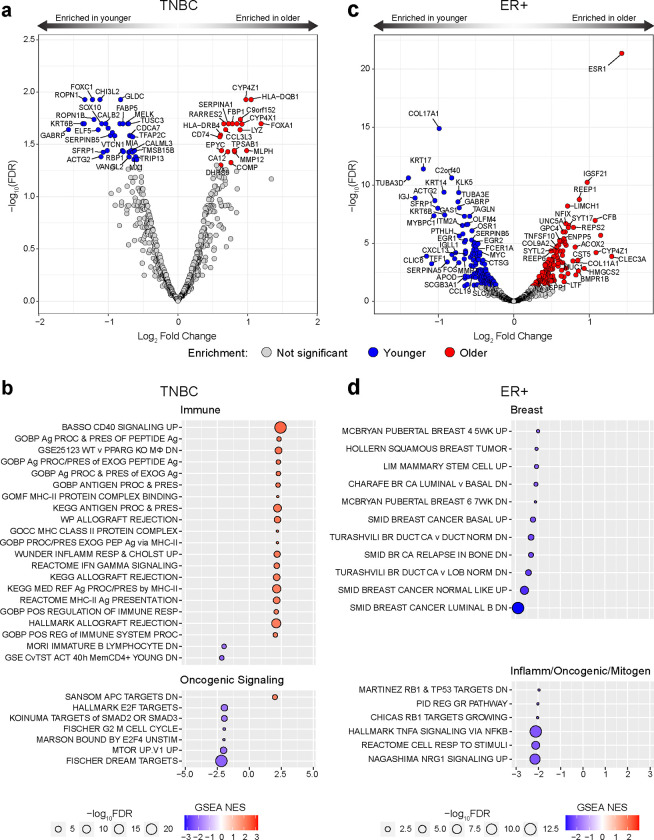
Figure 1 |. Age-related differentially expressed genes and functional gene set enrichments in TNBC and ER+ breast cancer.
a, c, Volcano plots showing log2fold change for high variance genes (by standard deviation) in tumors from patients with TNBC (a) and ER+ breast cancer (c), comparing the age groups < 45 years and > 65 years from METABRIC. Plots show log2fold change difference on the x-axis and −log10FDR on the y-axis. Red colored dots represent genes enriched in the >65 age group; blue colored dots are genes enriched in the <45 age group; false discovery rate <0.05 (−log10FDR > 0.1.301). n=50 TNBC <45; n=63 TNBC >65; n=86 ER+ <45; n=386 ER+ >65. b, d, Results of age-stratified gene set enrichment analysis (GSEA) of highly variable genes ranked by log2fold difference from a and c in TNBC (b) and ER+ breast cancer (d). Pathways are grouped by biological similarity. Red fill color indicates enrichment in the > 65 age group; blue indicates enrichment in the < 45 age group. Circle size is proportional to relative −log10(FDR) for the enrichment, and color depth represents magnitude of normalized enrichment score (NES), according to indicated scales.

