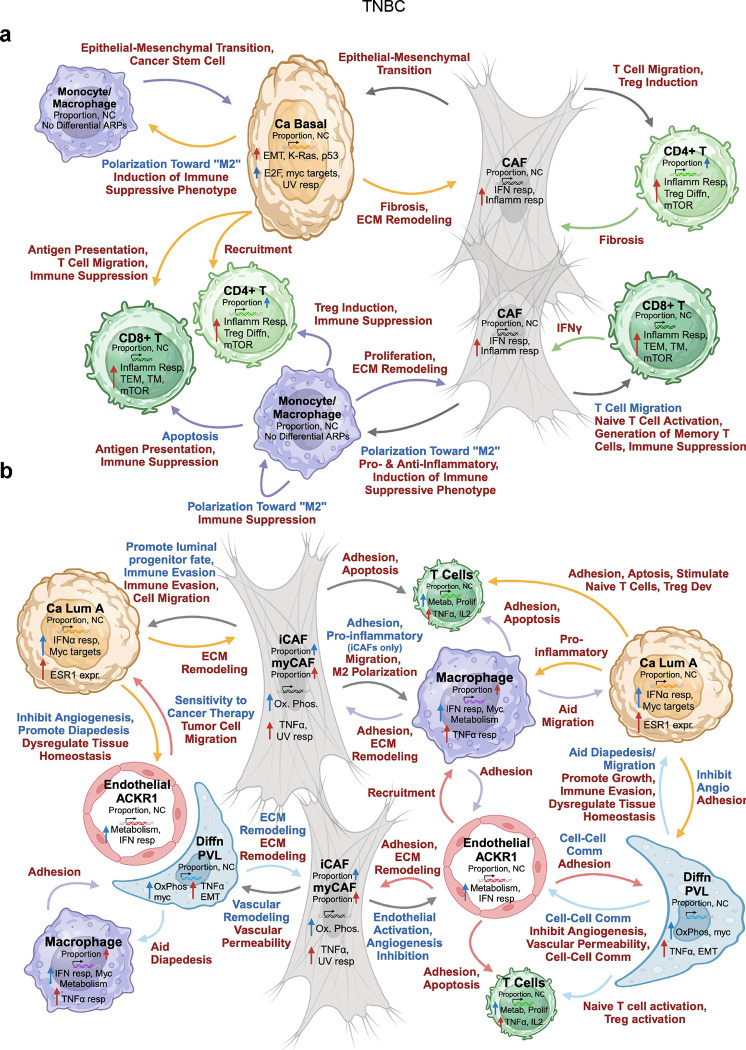
Figure 7 |. Working models of the age-related molecular landscapes of TNBC and ER+ breast cancer.
a, b, Schematic depicts biologically distinct functions with age in the TNBC (a) and ER+ (b) breast tumor microenvironment. Selected cell types within the tumor microenvironment are shown with abundance, transcriptional (from METABRIC and ASPEN analyses), and communication (from CellChat analysis) differences with age. Arrows between cell types are colored to coincide with the source cell. Arrows within a cell type and all text depict enrichment in older (red) or younger (blue) patients.

