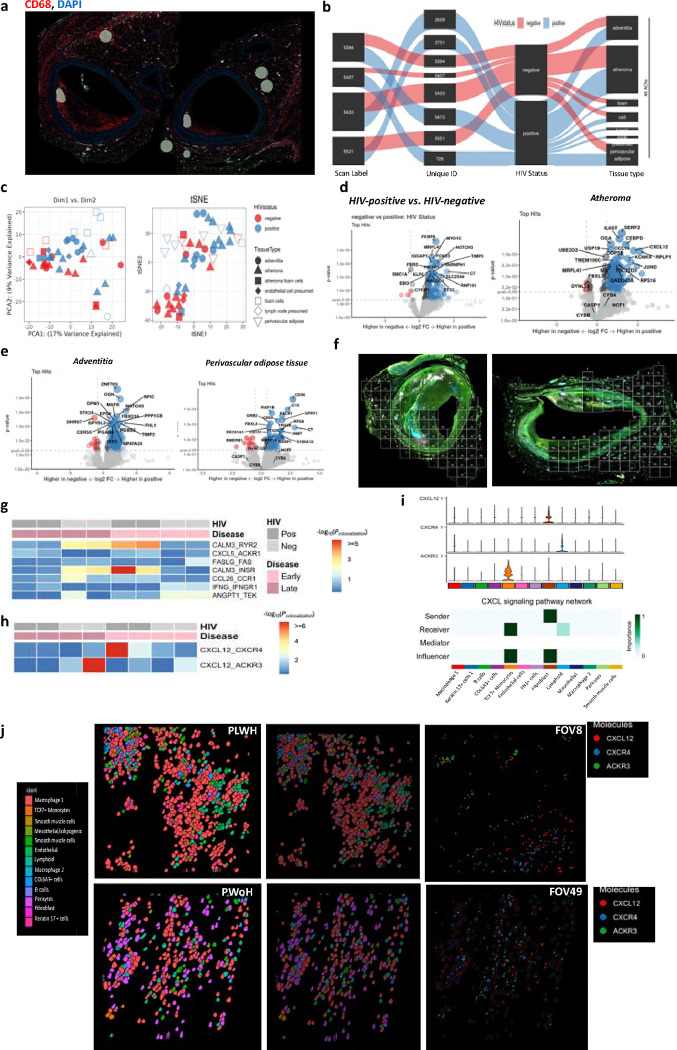
Figure 5. CXCL12 expression within coronaries is most detectable in atheroma and is predicted to interact with CXCR4 and ACKR3.
a, Regions of interest in coronary arteries were selected based on CD68 expression for spatial analysis using the GeoMX platform, as shown by the representative image. b, The Sankey plot shows the ROI distribution across different coronaries sections from four PLWH and four PWoH. The width of the lines is proportional to the representation of the different regions. c, Nanostring GeoMX whole transcriptomic sequences were obtained from selected regions of interest. PCA and tSNE plots show regions of interest that co-cluster together based on similarities in gene transcripts. d, The volcano plots show differential gene expression by HIV status in all regions and atheroma, e, adventitia, and perivascular adipose tissue. f, Two representative images showing the fields of view of regions selected in the coronary arteries from PLWH and PWoH. g, Heatmap showing the spatial colocalization of genes in coronary arteries, stratified by HIV status (Pos: HIV-positive, Neg: HIV-negative) and atheroma stages (Early vs. Late). The color scale indicates the significance of colocalization (blue: low significance, red: high significance). h, Heatmap showing colocalized expression of CXCL12 and its receptors CXCR4 and ACKR3 across HIV groups and atheroma stages. i, The violin plots show the gene counts of CXCL12, CXCR4, and ACKR3 in each cluster on the x-axis by color code. The heatmap right below shows the predicted CellChat ligand-receptor interactions. j, Representative CosMx fov’s (8 and 49) from coronary arteries of PLWH and PWoH with all cells’ x and y locations. Individual transcripts (CXCL12 - red, ACKR3-green, and CXCR4-blue) are shown on the fov images depicted as molecules. The figure legends are color-coded to depict the different cell types and molecules.

