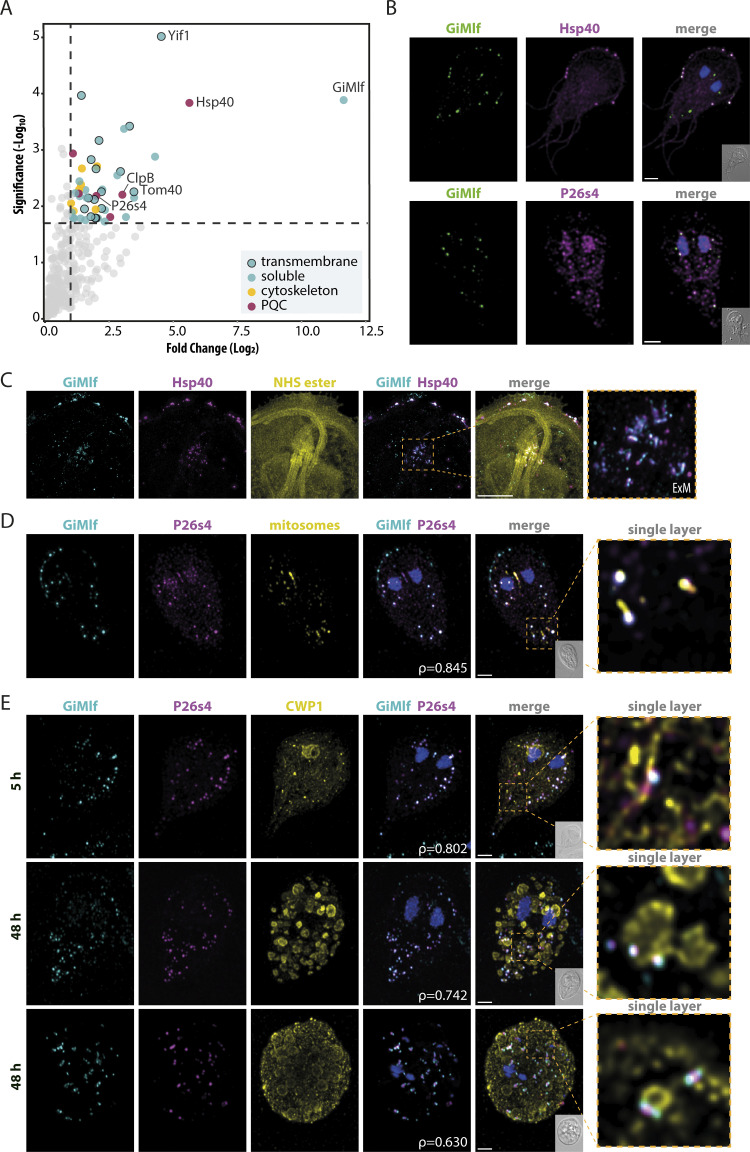
Fig 3. The interactome of GiMlf includes transmembrane proteins, cytoskeletal components, chaperones, and a proteasomal subunit.
(A) Volcano plot of the isolated GiMlf interactome using DSP crosslinking (P≤0.02, fold change >2, n = 3). Cytoskeletal components, PQC proteins, and transmembrane proteins are highlighted as indicated in the legend. Transmembrane topology prediction was performed using the DeepTMHMM tool. The indicated proteins were further analyzed in this study. (B) Localization of endogenously BAP-tagged GiMlf and V5-tagged putative interacting partners in trophozoites of G. intestinalis using confocal microscopy. The cells were stained with anti-BAP antibody (green) and anti-V5 antibody (magenta), scale bar: 2 μm (C) Localization of endogenously BAP-tagged GiMlf and V5-tagged Hsp40 at the basal bodies in trophozoites using expansion microscopy (ExM), scale bar: 10 μm. The cells were stained with anti-BAP antibody (cyan) and anti-V5 antibody (magenta), and NHS ester (primary amines of proteins, yellow). (D) Localization of endogenously BAP-tagged GiMlf and V5-tagged P26s4 at mitosomes in trophozoites of G. intestinalis using confocal microscopy. The cells were stained with anti-BAP antibody (cyan) and anti-V5 antibody (magenta), and an anti-GL50803_9296 antibody (yellow, mitosomal marker), scale bar: 2 μm The enlarged image shows a single layer of the image stack. Pearson’s correlation coefficient (ρ = 0.8448) was calculated for the subsection of GiMlf and P26s4 that colocalize in proximity to mitosomes. (E) Localization of endogenously BAP-tagged GiMlf and V5-tagged P26s4 in encysting cells of G. intestinalis in the early (5 hpi) and late (48 hpi) phases of encystation using confocal microscopy. The cells were stained with anti-BAP antibody (cyan) and anti-V5 antibody (magenta), and anti-CWP1 antibody (yellow), scale bar: 2 μm. The enlarged images show a single layer of the image stack. Pearson’s correlation coefficient (ρ) was calculated for each stack. Top panel—ρ = 0.802, middle panel—ρ = 0.742, bottom panel—ρ = 0.630.

