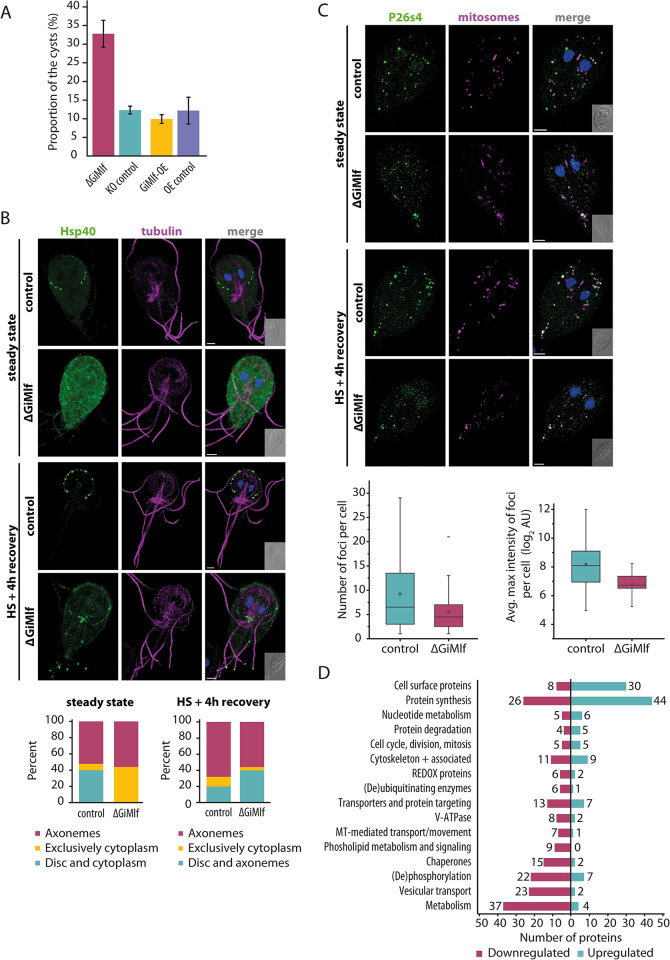
Fig 6. The absence of GiMlf leads to altered localization of Hsp40, a reduction in P26s4 foci, and broad changes in proteostasis.
(A) Comparison of cyst production of ΔGiMlf cell line, GiMlf-OE cell line and their respective control cell lines after 48 h of encystation (n = 3). (Two-tailed t-test with equal variance, P-value = 0.002). The cyst production of GiMlf-V5-overexpression cell line did not differ significantly (Two-tailed t-test with equal variance, P-value = 0.45) when compared to its control. (B) Top–Localization of V5-tagged Hsp40 in control and ΔGiMlf cells in steady state and after 4 hours of recovery after heat shock. The cells were stained with an anti-V5 antibody (green) and an anti-acetylated tubulin (magenta). Nucleic DNA was stained with DAPI (blue). Scale bars: 2 μm. Bottom–The plotted overall distribution of Hsp40 in steady state and at 4 hours of recovery after heat shock (n = 50). (C) Top–Localization of V5-tagged P26S4 in control and ΔGiMlf cells under steady conditions and after 4 hours of recovery after heat shock. The cells were stained with an anti-V5 antibody (green) and an anti-GL50803_9296 antibody (mitosomal marker; magenta). Nucleic DNA was stained with DAPI (blue). Scale bars: 2 μm. Bottom–The box plots compare the number (left; significance determined with two-tailed t-test with unequal variance, P-value = 0.01) and the average max intensity (right; significance determined with two-tailed t-test with unequal variance, P-value = 0.002) in control and ΔGiMlf cells in steady state (n = 40). (D) A diagram depicting number of proteins with significant changes in expression within different functional groups in the ΔGiMlf cell line. Statistical significance was assessed using a two-sample test with permutation-based FDR with a value set at 0.05 (n = 3).

