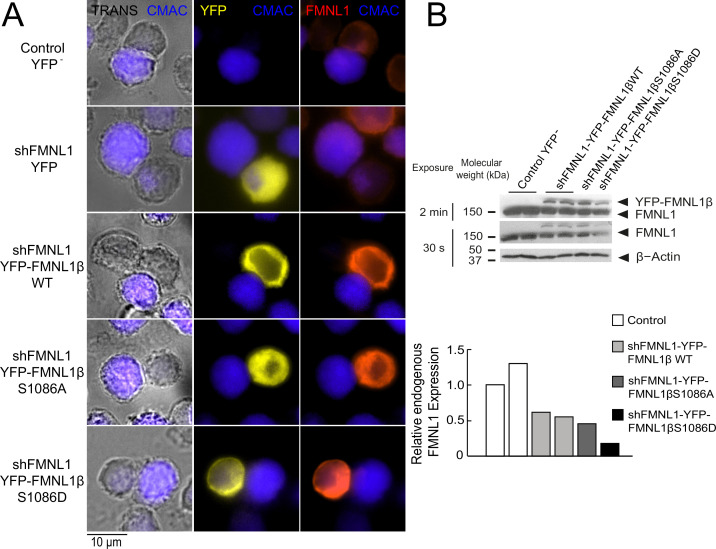
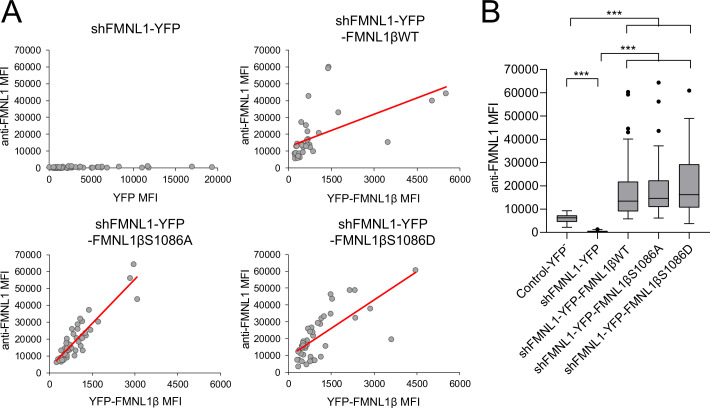
Figure 2. Expression of YFP-FMNL1β S1086 variants in FMNL1-silenced cells.
(A) C3 control clone was untransfected (Control YFP-) (first row) or transfected with FMNL1-interfering (shFMNL1-HA-YFP) (second row), or FMNL1-interfering expressing interference-resistant YFP-FMNL1βWT (shFMNL1-HA-YFP-FMNL1βWT) (third row), YFP-FMNL1βS1086A (fourth row), or YFP-FMNL1βS1086D (fifth row) constructs. Subsequently, cells were challenged with CMAC-labeled SEE-pulsed Raji cells (blue) for 1 hr, fixed, stained with anti-FMNL1, and imaged by epifluorescence microscopy. Representative maximum intensity projection (MIP) images of merged transmittance (TRANS), CMAC (blue), YFP (yellow), and anti-FMNL1 (red) channels are indicated for the different cell groups. (B) Cell lysates corresponding to the indicated cell groups were analyzed by western blot (WB) developed with anti-FMNL1 antibody (two different expositions). The lower bar graph depicts the WB quantification showing the endogenous FMNL1 expression in the different cell groups relative to control untransfected (YFP-) cells. Results are representative of data from several independent experiments (n=3) with similar results.


