. 2024 Oct 31;13:RP96942. doi: 10.7554/eLife.96942

Figure 4. FMNL1β phosphorylation at S1086 is involved in microtubule-organizing center (MTOC)/multivesicular bodies (MVB) polarization toward the immune synapse (IS).

C3 control clone was untransfected (Control YFP-) (first row) or transfected with FMNL1-interfering (shFMNL1-HA-YFP) (second row), or FMNL1-interfering expressing interference-resistant YFP-FMNL1βWT (shFMNL1-HA-YFP-FMNL1βWT) (third row), YFP-FMNL1βS1086A (fourth row), or YFP-FMNL1βS1086D (fifth row) constructs. Subsequently, cells were challenged with CMAC-labeled, SEE-pulsed Raji cells (blue) for 1 hr, fixed, stained with anti-pericentrin (magenta) to label the MTOC and anti-CD63 (red) to label MVB, and imaged by epifluorescence microscopy. (A) Representative maximum intensity projection (MIP) images with the indicated merged channels for each of the specified cell groups, along with a schematic diagram on the right representing the measured parameters used to calculate the MTOC and MVB polarization index (PI). This includes the distance in microns between the MTOCC (or MVBC) projection on the vector defined by the CellC-synapse axis and the CellC (‘B’ or ‘A’ distance, respectively), and the distance between the CellC and the synapse (‘C’ distance). (B) Dot plots of MVB and MTOC PI from each of the indicated cell groups, corresponding to the indicated number of synapses from a experiment similar to that described in (A) are depicted. NS, not significant. ***, p<0.05. Results and ANOVA are representative of data from several independent experiments (n=3) with similar results.

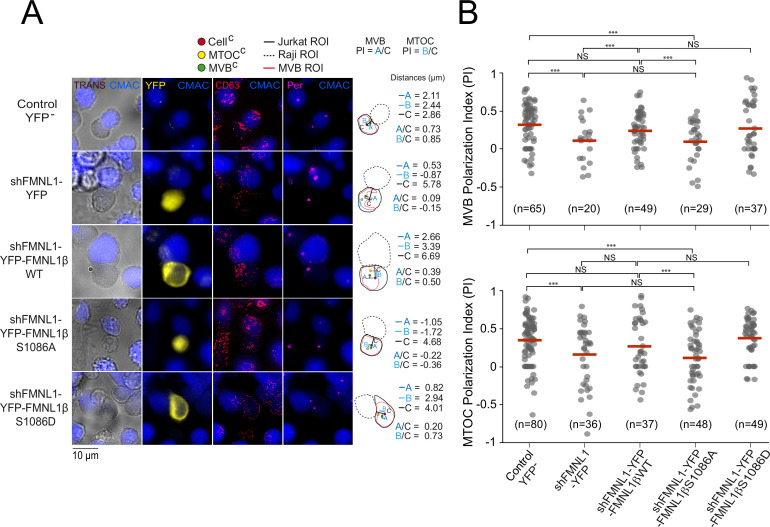
Figure 4.

Figure 4—figure supplement 1. SEE-induced polarization of multivesicular bodies (MVB) and microtubule-organizing center (MTOC) to the immune synapse (IS) and calculation of their polarization indexes.

Figure 4—figure supplement 1.

(A) In the left panels, synaptic cell conjugates made by Jurkat cells with CMAC-labeled, SEE-pulsed Raji cells (blue) were fixed, permeabilized and stained with anti-CD63 (red) and anti-pericentrin (magenta) antibodies to label MVB and the MTOC, respectively. The white arrow indicates the IS area. In the right-side scheme, the distances in color (‘A’, blue; ‘B’, cyan; and ‘C’, black) used for the calculation of both MVB and MTOC polarization index (PI) (A/C and B/C, respectively) are indicated. The dark-red dot represents the cell geometric center (Cellc), whereas the yellow and green dots indicate the MTOC and MVB center of mass (MTOCc and MVBc), respectively. The line ‘C’ represents the distance between the Cellc and the synapse, and the projections of both MTOCc and MVBc on the ‘C’ line are labeled with red crosses (MTOC/MVBproj). Since the CellC position was taken as the origin to measure distances, those ‘A’ or ‘B’ values in the opposite direction to the synapse were taken as negative. Thus, PI ranged from +1 to –1. The Raji cells and the Jurkat clones are labeled with discontinuous and continuous white lines, respectively. (B) C3 control and PKCδ-interfered P5 clone were untransfected (Control YFP-) or transfected with FMNL1-interfering (shFMNL1-HA-YFP). Subsequently, cells were challenged with CMAC-labeled, unpulsed (SEE-), or SEE-pulsed (SEE+) Raji cells for 1 hr, fixed, stained with anti-pericentrin (magenta) to label the MTOC and imaged by epifluorescence microscopy to measure MTOC PI as indicated in (A). The dot plot shows the MTOC PI of each indicated cell group. NS, not significant; ***, p<0.05. Results and ANOVA are representative of the data from several independent experiments (n=3) with similar results.
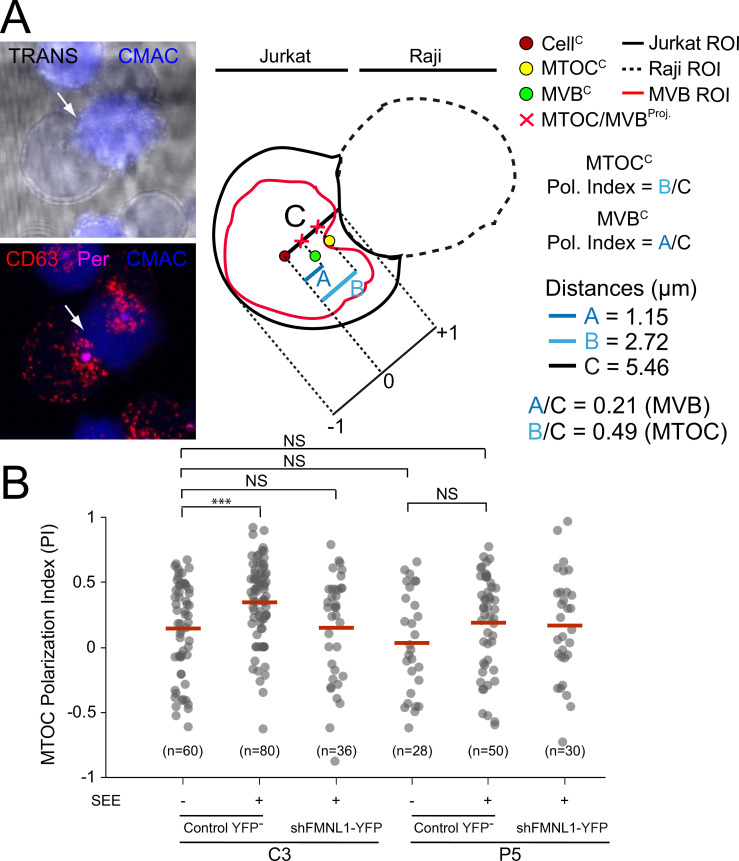
Figure 4—figure supplement 2. FMNL1β phosphorylation at S1086 is involved in microtubule-organizing center (MTOC)/multivesicular bodies (MVB) polarization toward the immune synapse (IS).

Figure 4—figure supplement 2.

Confocal analysis. Untransfected, C3 clone (Control YFP-) (first row) and C3 clone transfected (yellow) with either FMNL1-interfering (shFMNL1-HA-YFP) (second row) or FMNL1-interfering and expressing interference-resistant YFP-FMNL1βWT (shFMNL1-HA-YFP-FMNL1βWT) (third row), or YFP-FMNL1βS1086A (fourth row), or YFP-FMNL1βS1086D (fifth row) constructs, were challenged with CMAC-labeled, SEE-pulsed Raji cells (blue) for 1 hr to form IS. Then, cell conjugates were fixed, stained with anti-pericentrin to label the MTOC (magenta) and anti-CD63 to label MVB (red), and imaged by confocal fluorescence microscopy. (A) Representative maximum intensity projection (MIP) images with merged channels of each cell group specified in the left side, and the diagrams on the right represent the measurements of the parameters used to calculate the MTOC and MVB polarization index (PI), including the distance between the IS and the center of the cell (CellC) and the IS (line C), the MTOCC (line B) and the MVBC (line A). Jurkat cell outlines are labeled with a continuous line, Raji cells are labeled with a dashed line, whereas regions of interest (ROI) containing MVB are labeled with a continuous red line. (B) MTOC and MVB PI dot plot for the different cell groups corresponding to the indicated number of synapses from a similar experiment to that described in (A) are represented. This figure is related to Figure 4. NS, not significant. ***, p<0.05. Results and ANOVA are representative of the data from several independent experiments (n=3) with similar results.
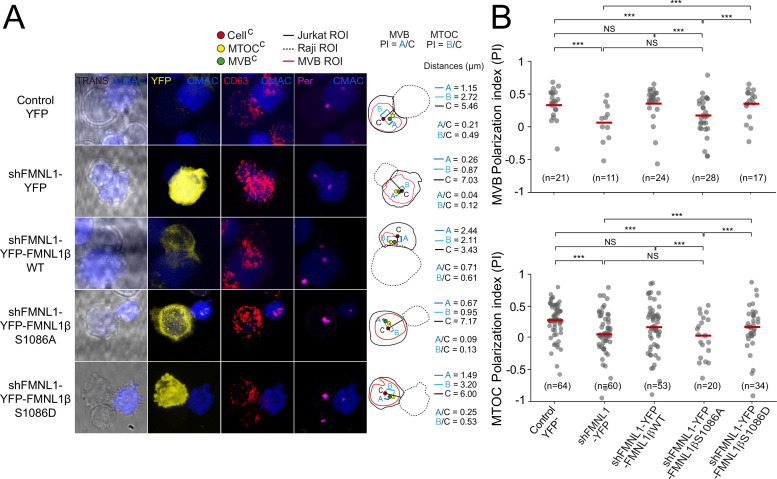
Figure 4—figure supplement 3. T cell en face analysis of F-actin and microtubule-organizing center (MTOC) distribution at the immune synapse (IS) interface.

Figure 4—figure supplement 3.

C3 control clone was untransfected (Control YFP-) (first column) or transfected with FMNL1-interfering (shFMNL1-HA-YFP) (second column), or FMNL1-interfering expressing interference-resistant YFP-FMNL1βWT (shFMNL1-HA-YFP-FMNL1βWT) (third column), YFP-FMNL1βS1086A (fourth column), or YFP-FMNL1βS1086D (fifth column) constructs. Subsequently, cells were challenged with CMAC-labeled SEE-pulsed Raji cells (blue) for 1 hr, fixed, stained with phalloidin (magenta) and anti-γ-tubulin (red). The corresponding shFMNL1 constructions are in yellow, and cells were imaged by confocal fluorescence microscopy. Please realize that F-actin (acquired in magenta) was changed to blue color. The upper row includes the top, yx views corresponding to the maximum intensity projection (MIP) images of representative examples of each transfected cell group. In the second row, the same examples are displayed, showing the relative MTOC position of each transfected cell group and MTOC polarization index (PI) is indicated in white types. Vertical white arrows indicate the direction to visualize the en face views of the IS (IS interface) enclosed by the regions of interest (ROIs) (white rectangles), as shown in Video 1. Subsequently, in the third row the en face zx views were generated by merging the indicated channels in the second row of each panel (F-actin in blue merged to anti-γ-tubulin in red), on the IS interfaces of the synaptic areas (generated as shown in Video 1). The last frame of this video corresponds to en face view (interface) (third row). Mean fluorescence intensity (MFI) profiles along the indicated line (horizontal white arrow) of each separate channel (F-actin in blue, anti-γ-tubulin in red) are shown below the IS interfaces. This figure is related to Figures 4 and 7. Results are representative of data from several independent experiments (n=3) with similar results.
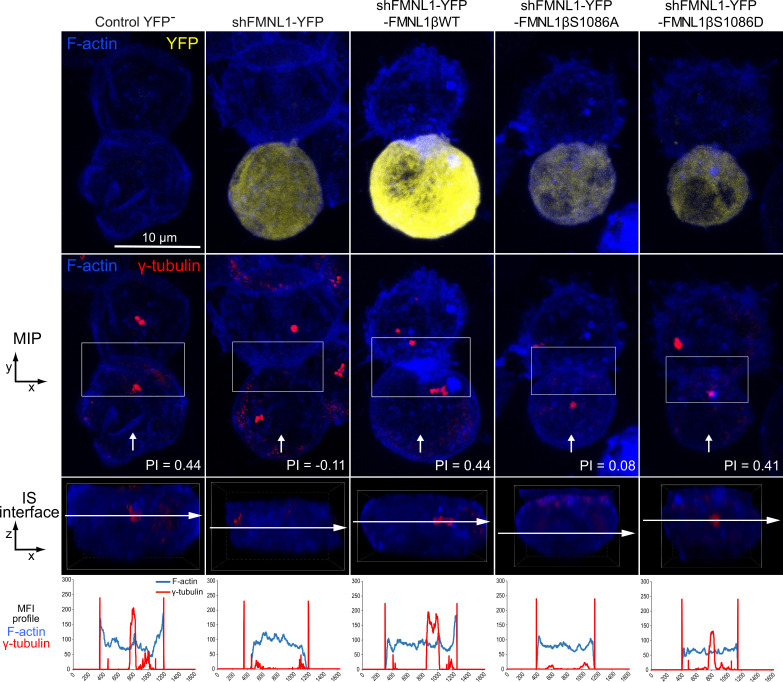
Figure 4—figure supplement 4. T cell en face analysis of F-actin and multivesicular bodies (MVB) distribution at the immune synapse (IS) interface.

Figure 4—figure supplement 4.

C3 control clone was untransfected (Control YFP-) (first column) or transfected with FMNL1-interfering (shFMNL1-HA-YFP) (second column), or FMNL1-interfering expressing interference-resistant YFP-FMNL1βWT (shFMNL1-HA-YFP-FMNL1βWT) (third column), YFP-FMNL1βS1086A (fourth column), or YFP-FMNL1βS1086D (fifth column) constructs. Subsequently, cells were challenged with CMAC-labeled SEE-pulsed Raji cells (blue) for 1 hr, fixed, stained with phalloidin (magenta) and anti-CD63 (red). The corresponding shFMNL1 constructions are in yellow, and cell conjugates were imaged by confocal fluorescence microscopy. Please realize that F-actin (acquired in magenta) was changed to blue color. The upper row includes the top, yx views corresponding to the maximum intensity projection (MIP) images of representative examples of each transfected cell group. In the second row, the same examples are displayed, showing the MVB position in each transfected cell group and MVB polarization index (PI) is indicated in white types. Vertical white arrows indicate the direction to visualize the en face views of the IS (IS interface) enclosed by the regions of interest (ROIs) (white rectangles), as shown in Video 2. The white cross represents the position of the geometric center of the Jurkat cell (CellC), while the white square represents the position of the center of mass of the distribution of MVB (MVBC) that it is an unbiased parameter that mirrors MVB center of mass polarization. Subsequently, in the third row, the en face zx views were generated by merging the indicated channels in the second row of each panel (F-actin in blue merged to anti-CD63 in red), on the IS interfaces of the synaptic areas (generated as shown in Video 2). The last frame of these videos corresponds to en face views (interface) (third row). Mean fluorescence intensity (MFI) profiles along the indicated line (horizontal white arrow) of each separate channel (F-actin in blue, anti-CD63 in red) are shown below the IS interfaces. When MVB are not polarized, some MVB can still be observed at central region of the IS (cIS) because they are scattered throughout the cell. For instance, the YFP-FMNL1βWT transfected cell (third column) shows a pronounced MVB concentration within the synaptic area (white rectangle), whereas the YFP-FMNL1βS1086A transfected cell (fourth column), as it presents a scattered distribution of MVB throughout the cell, also exhibits some MVB (but only a small proportion of the total cellular MVB) in the synaptic area (second row). This figure is related to Figures 4 and 7. Results are representative of the data from several independent experiments (n=3) with similar results.
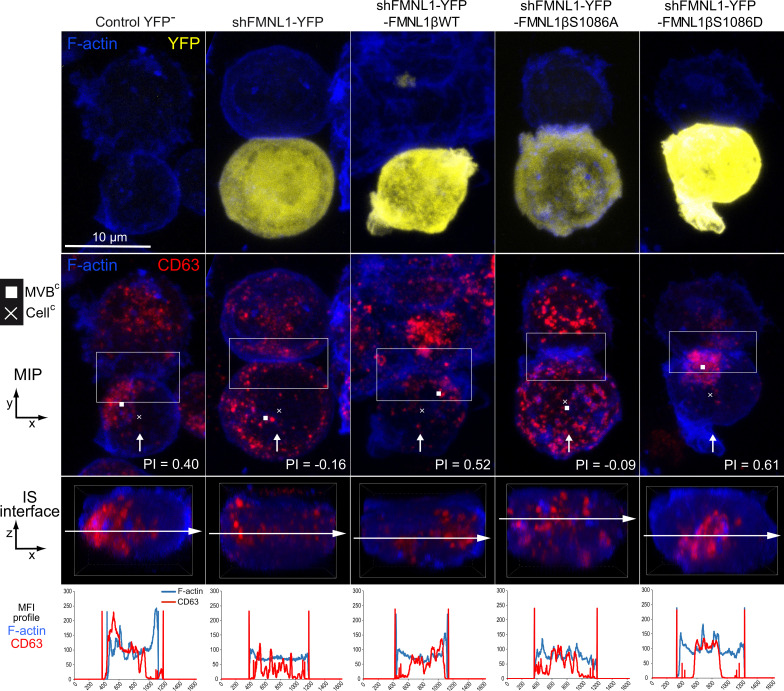
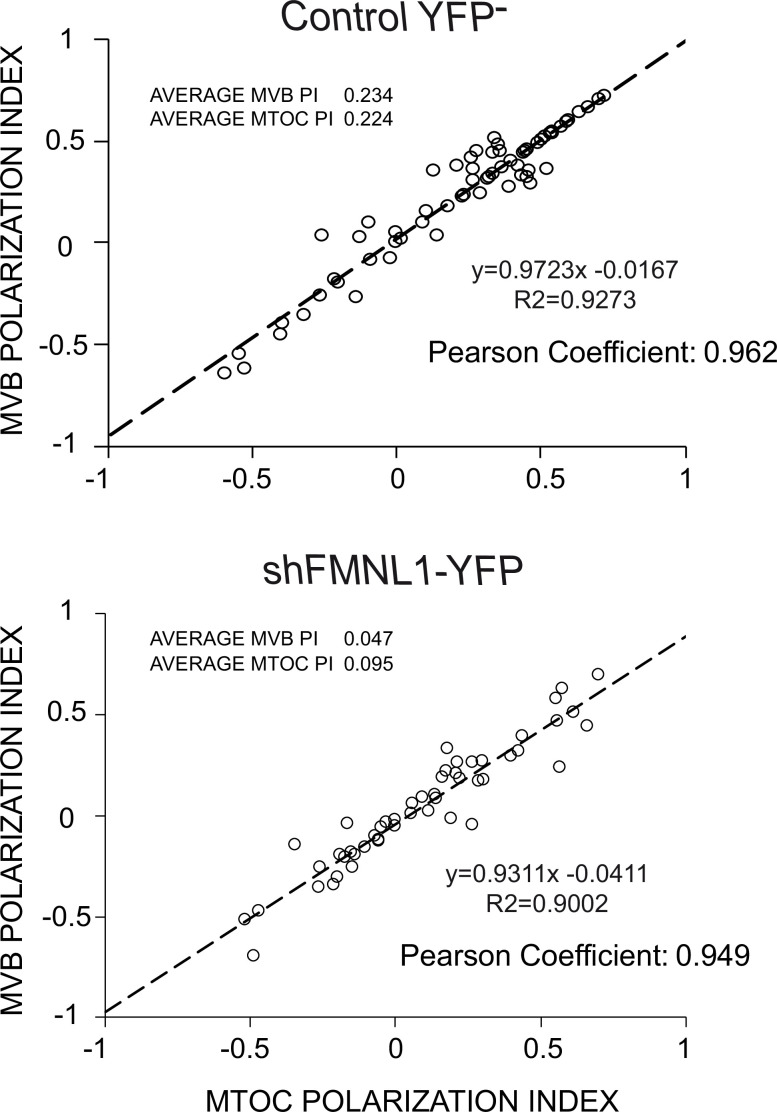
Figure 4—figure supplement 5. Correlation between microtubule-organizing center (MTOC) and multivesicular bodies (MVB) polarization indexes.

Figure 4—figure supplement 5.

C3 control untransfected (Control YFP-) and C3 transfected with the FMNL1-interfering plasmid (shFMNL1-HA-YFP) were challenged with CMAC-labeled SEE-pulsed Raji cells for 1 hr, fixed, stained with anti-γ-tubulin AF647 to label MTOC and anti-CD63 AF546, to label MVB and imaged by confocal fluorescence microscopy. Subsequently, MTOC and MVB polarization index (PI) were calculated for the synapses established by both cell groups, as described in Materials and methods and shown in schematic representation in Figure 4—figure supplement 1A. Linear correlation analyses between the MTOC and MVB PI for both cell groups are represented, as well as the corresponding linear correlation analysis data and the Pearson’s coefficients. Dashed lines represent the adjusted, regression line. This figure is related to Figure 4. Results are representative of data from several independent experiments (n=3) with similar results.