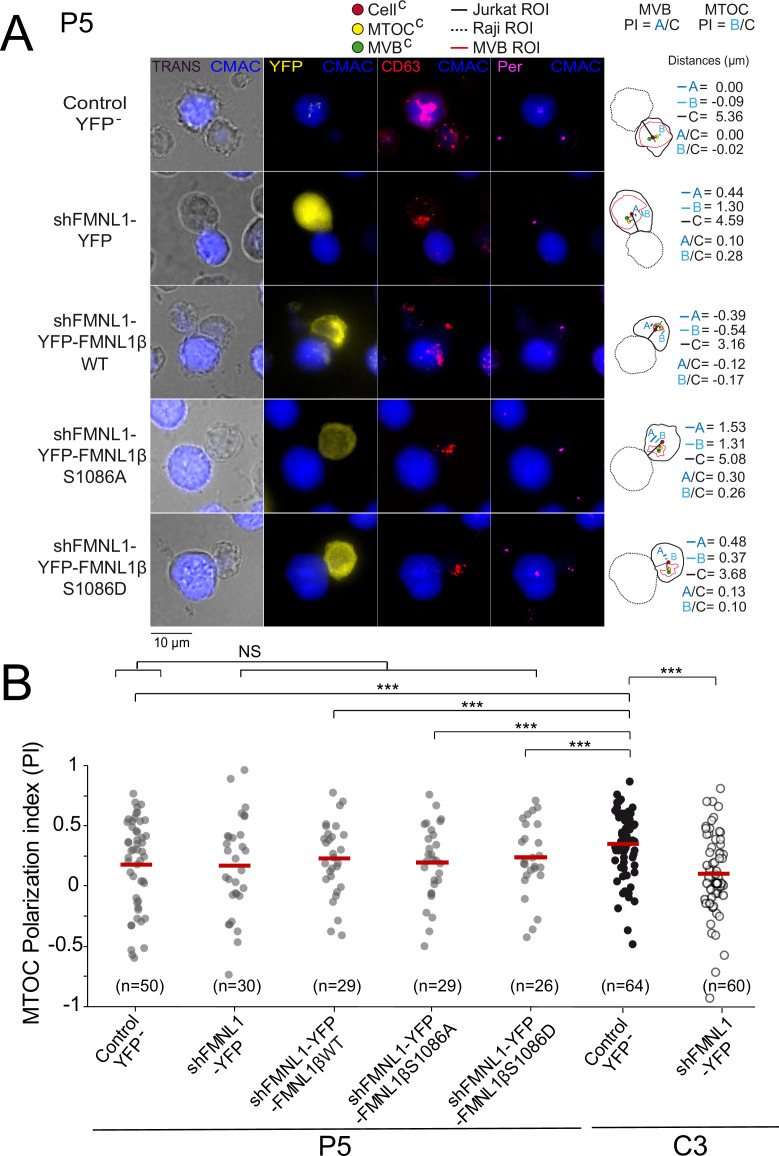
Figure 5. YFP-FMNL1βS1086D expression does not rescue deficient microtubule-organizing center (MTOC) polarization in PKCδ-interfered cells.
PKCδ-interfered P5 clone was untransfected (Control YFP-) (first row) or transfected with FMNL1-interfering (shFMNL1-HA-YFP) (second row), FMNL1-interfering expressing interference-resistant YFP-FMNL1βWT(shFMNL1-HA-YFP-FMNL1βWT) (third row), YFP-FMNL1βS1086A (fourth row), or YFP-FMNL1βS1086D (fifth row) constructs. In parallel, C3 control clone was untransfected (Control YFP-) or transfected with FMNL1-interfering (shFMNL1-HA-YFP) construct. Subsequently, cells were challenged with CMAC-labeled, SEE-pulsed Raji cells (blue) for 1 hr, fixed, stained with anti-pericentrin (magenta) to label the MTOC and anti-CD63 (red) to label multivesicular bodies (MVB), and imaged by epifluorescence microscopy. (A) Representative maximum intensity projection (MIP) images with the indicated merged channels for each of the specified cell groups along with their corresponding diagrams as in Figure 4, representing the measured parameters used for calculating the MTOC and MVB polarization index (PI) are shown. This includes the distance in microns between the MTOCC (or MVBC) projection on the vector defined by the CellC-synapse axis and the CellC (‘B’ or ‘A’ distance, respectively), and the distance between the CellC and the synapse (‘C’ distance). (B) Dot plots of MTOC PI of each cell group. Untransfected (Control YFP-) and FMNL1-interfering (shFMNL1-HA-YFP) C3 clone synapses corresponding to the data shown in Figure 4—figure supplement 2B were included in the far-right columns, as a reference. NS, not significant; ***, p<0.05. Results and ANOVA are representative of data from several independent experiments (n=3) with similar results.

