. 2024 Oct 31;13:RP96942. doi: 10.7554/eLife.96942

Figure 6. FMNL1β recruitment to the immune synapse (IS) is protein kinase C δ (PKCδ)-independent.

C3 control and P5 PKCδ-interfered cells were transfected with FMNL1-interfering expressing interference-resistant YFP-FMNL1βWT (shFMNL1-HA-YFP-FMNL1βWT) plasmid. Subsequently, both transfected clones were simultaneously challenged with CMAC-labeled, SEE-pulsed Raji cells (blue) attached to slides and time-lapse acquisition of emerging synapses was performed as indicated in Materials and methods. The videos (7 fps) (Figure 6—video 1) were captured and in (A), left, representative frames from videos of each clone are shown. White arrows indicate accumulations of YFP-FMNL1βWT at the IS. Western blot (WB) analysis of cell lysates from both clones (top inset) shows PKCδ silencing in P5 clone. In the right side, YFP-FMNL1βWT mean fluorescence intensity (MFI) within the cell regions of interest (ROI) (gray line) and the IS ROI (red line) are represented. The inserts in the graphs include the cell ROI (white) and the IS ROI (red) used for the time-lapse measurements on representative frames for both clones. Results are representative of the data from several videos (n=6 for each clone) with similar results. (B) Control C3 (upper rows) and P5 PKCδ-interfered cells (lower rows) were simultaneously challenged with CMAC-labeled SEE-pulsed Raji cells (blue) attached to slides. After 1 hr, synapses were fixed and immunofluorescence developed with anti-FMNL1 (red) to label endogenous FMNL1 and phalloidin (magenta) to label F-actin. Synapses were imaged with confocal fluorescence microscopy and colocalization pixels between FMNL1 (red) and F-actin (acquired in magenta, changed to blue in the fourth column) are represented in white. Representative optical sections of synapses formed by both clones are shown in the left columns. The colocation coefficients were: first row, Pearson = 0.50, Manders-=0.877; second row, Pearson = 0.431, Manders = 0.864; third row: Pearson = 0.434, Manders = 0.838; fourth row, Pearson = 0. 484, Manders = 0.794. Maximum intensity projection (MIP) images of the same synapses are shown in the two far-right columns. Results and ANOVA are representative of data from several independent experiments (n=3) with similar results.

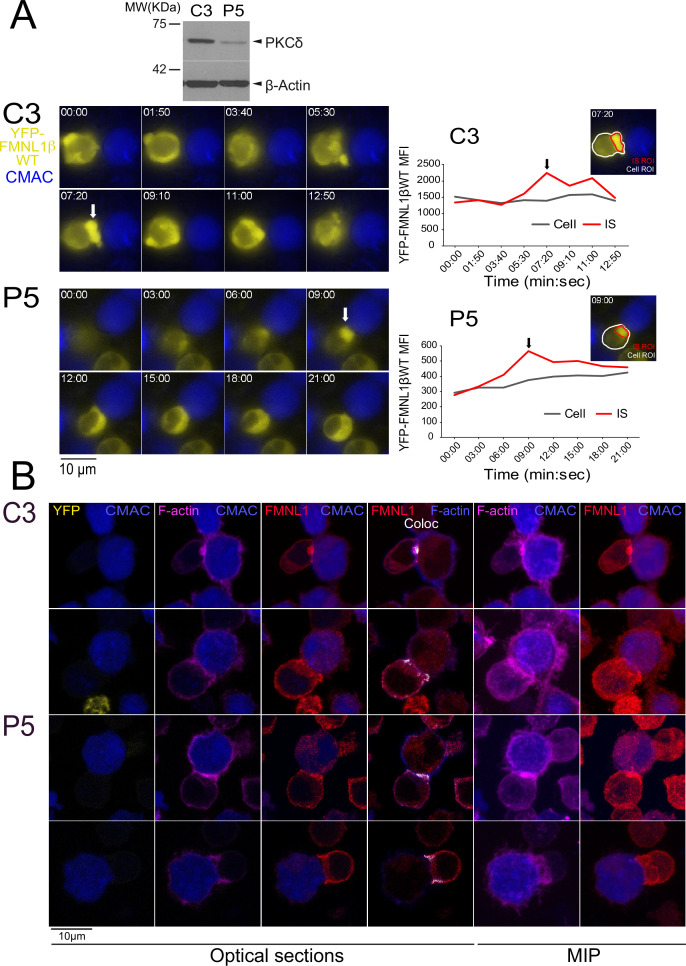
Figure 6—source data 1. Original, uncropped WBs corresponding to the upper panel in Figure 6A in PDF format.
White rectangles label the 2 cropped panels used in Figure 6A.
Figure 6—source data 2. Original, uncropped WBs corresponding to the upper panel in Figure 6A in TIF format.

Figure 6.

Figure 6—figure supplement 1. FMNL1 is located at the immune synapse (IS) developed by primary T lymphoblasts and dual chimeric antigen receptor (CAR) T cells recognizing CD19/CD22.

Figure 6—figure supplement 1.

Primary T lymphoblasts and dual CAR T cells recognizing CD19/CD22 growing in the presence of recombinant human IL-2 cells were challenged with SEE plus SEB-pulsed Raji cells for 30 min (A), or Raji cells for 1 hr (B), respectively. After the indicated co-culture times, cell conjugates were fixed, and stained with phalloidin AF488 (green), anti-pericentrin (magenta), and anti-FMNL1 (red). Synapses were imaged with confocal fluorescence microscopy and colocalization pixels between FMNL1 (red) and F-actin (green) are represented in white (Coloc). Representative maximum intensity projection (MIP) and optical sections of synapses formed by both cell types are shown in the left-side columns. The effector T lymphocytes are labeled with a yellow arrow in these figures. The F-actin/FMNL1 colocalization coefficients measured in the IS regions of interest (ROI) are indicated in the second column. In the right-side columns, top views and IS interface views of the IS are included, as well as the F-actin IS interface architecture and microtubule-organizing center (MTOC) position. The multifocal nature of the synapse developed by CAR T cells (Davenport et al., 2018) is evident. This figure is related to Figure 6 and Figure 8. The percentage of synapse conjugates substantiating endogenous FMNL1 at the IS was 15% for lymphoblasts and 12% for CAR T, respectively, with at least 120 synapses analyzed per condition. Results are representative of data from several independent experiments (n=3) with similar results.
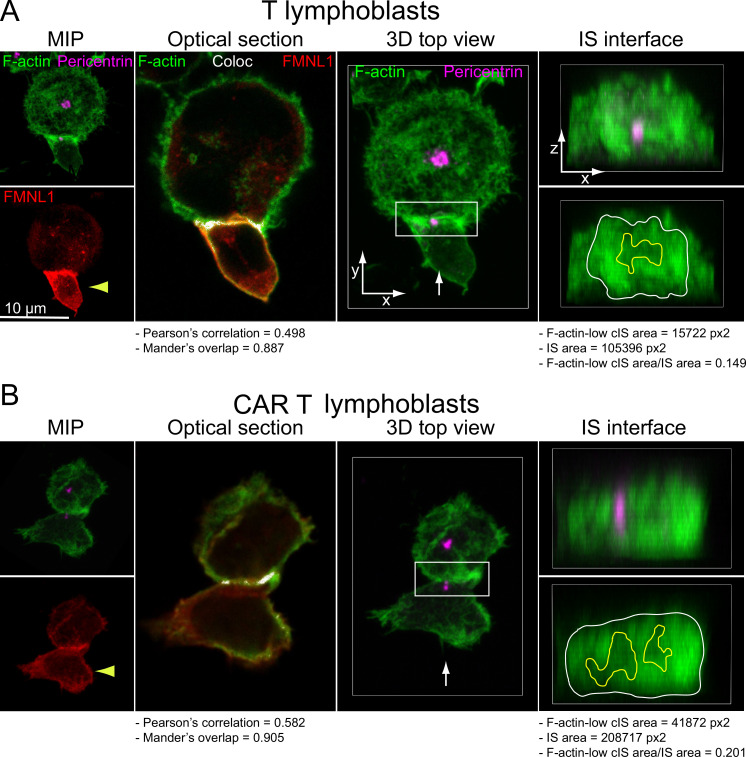
Figure 6—figure supplement 2. YFP-FMNL1βS1086A and S1086D mutants are recruited to the immune synapse (IS).

Figure 6—figure supplement 2.

C3 control cells were transfected with FMNL1-interfering expressing interference-resistant YFP-FMNL1βS1086A or S1086D (shFMNL1-HA-YFP-FMNL1βS1086A or shFMNL1-HA-YFP-FMNL1βS1086D) plasmids. Subsequently, transfected cells were simultaneously challenged with CMAC-labeled, SEE-pulsed Raji cells (blue) attached to slides and time-lapse acquisition of emerging synapses was performed as indicated in Materials and methods. The videos (7 fps) (Video 3) were captured and in the left side, representative frames from each video are shown. White arrows indicate accumulations of YFP-FMNL1βS1086A or S1086D at the IS. In the right side, YFP-FMNL1βS1086A or S1086D mean fluorescence intensity (MFI) within the cell regions of interest (ROI) (gray line) and the IS ROI (red line) are represented. The inserts in the diagrams include the cell ROI (white) and the IS ROI (red) used for the time-lapse measurements on representative frames for both FMNL1β mutants. This figure is related to Figure 6 and Video 3. At least six synapses of each cell group were analyzed. Results are representative of data from several independent experiments (n=3) with similar results.
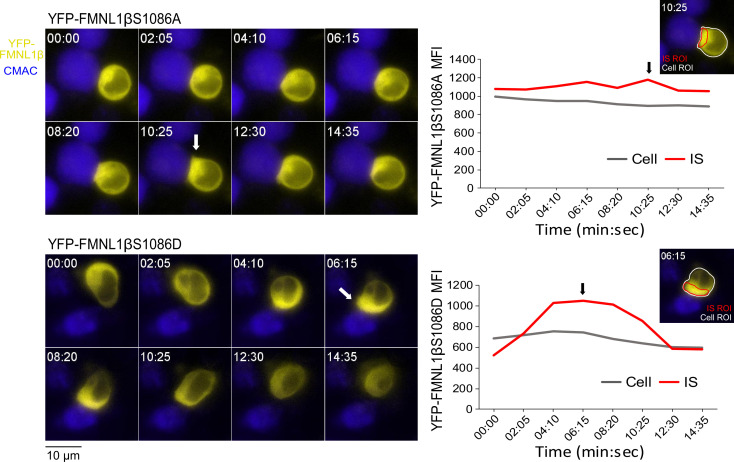
Figure 6—figure supplement 3. FMNL1 and FMNL1β accumulation at the immune synapse (IS) revealed by epifluorescence microscopy.

Figure 6—figure supplement 3.

C3 control clone was untransfected (Control YFP-) (first row) or transfected with FMNL1-interfering expressing interference-resistant YFP-FMNL1βWT (shFMNL1-HA-YFP-FMNL1βWT) (second row) or YFP-FMNL1βS1086A (third row) or YFP-FMNL1βS1086D (fourth row) constructs. Subsequently, cells were challenged with CMAC-labeled SEE-pulsed Raji cells (blue) for 1 hr, fixed, stained with anti-pericentrin (magenta) and anti-FMNL1 (red), and imaged by epifluorescence microscopy. The corresponding FMNL1β constructions are in yellow, whose signal is observed in both the first and third columns. The first and second columns represent those individual optical sections in which the accumulation of FMNL1 or FMNL1β variant in the IS formed by each cell group is better visualized, while the third and fourth columns represent maximum intensity projections (MIPs) of the same selected cells. FMNL1 or FMNL1β variant accumulation at the IS can be visualized in each cell group in red or yellow, respectively. This figure is related to Figure 6. Results are representative of the data from several independent experiments (n=3) with similar results.
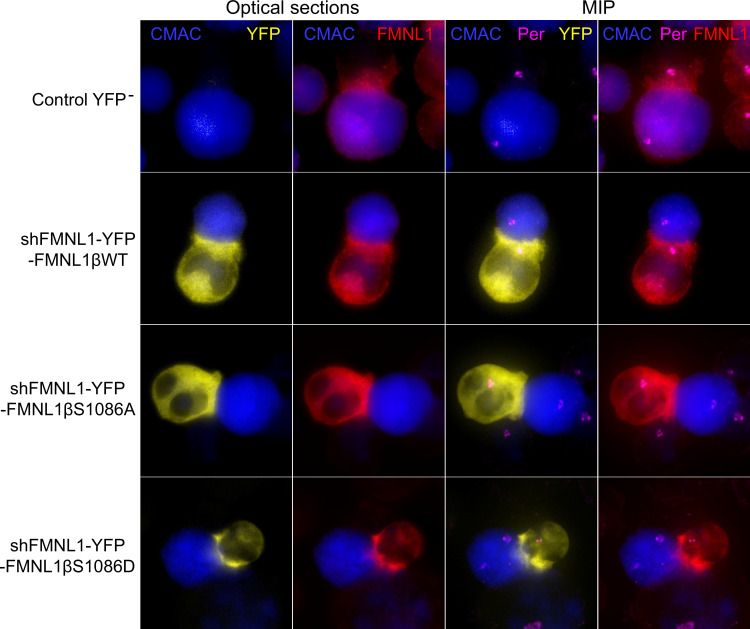
Figure 6—figure supplement 4. YFP-FMNL1β variants accumulation at the immune synapse (IS) revealed by confocal fluorescence microscopy.

Figure 6—figure supplement 4.

C3 control clone was transfected with FMNL1-interfering expressing interference-resistant YFP-FMNL1βWT (shFMNL1-HA-YFP-FMNL1βWT) (first and second rows), YFP-FMNL1βS1086A (third and fourth rows), or YFP-FMNL1βS1086D (fifth and sixth rows) constructs. Subsequently, cells were challenged with CMAC-labeled SEE-pulsed Raji cells (blue) for 1 hr, fixed, stained with phalloidin (magenta) and anti-FMNL1 (red). The corresponding shFMNL1 constructions are in yellow, and cells were imaged by confocal fluorescence microscopy. (A) Top views corresponding to representative examples of each transfected cell group are shown. The first column includes those individual optical sections in which the accumulation of each FMNL1β variant in the IS formed by each cell group is better visualized. Please realize that, since colocalization in NIS-AR only works with red, green, and blue channels, F-actin (acquired in magenta) was changed to blue color, and YFP (acquired in yellow) was changed to green in the second column of each panel, where colocalization pixels between anti-FMNL1 or YFP-FMNL1β and F-actin in the same optical section are shown in white. The third column displays the regions of interest (ROIs) used to measure the indicated colocalization coefficients. The Pearson’s and Manders’ colocalization coefficients for each of the selected cells are displayed. (B) The maximum intensity projections (MIPs) of the same cells displayed in (A) are shown. At the right side, the relative mean fluorescence intensity (MFI) quantification of the accumulation at the IS of YFP-FMNL1β variants and FMNL1 compared to the signal of the entire cell is shown. This figure is related to Figure 6. Results are representative of data from several independent experiments (n=3) with similar results.
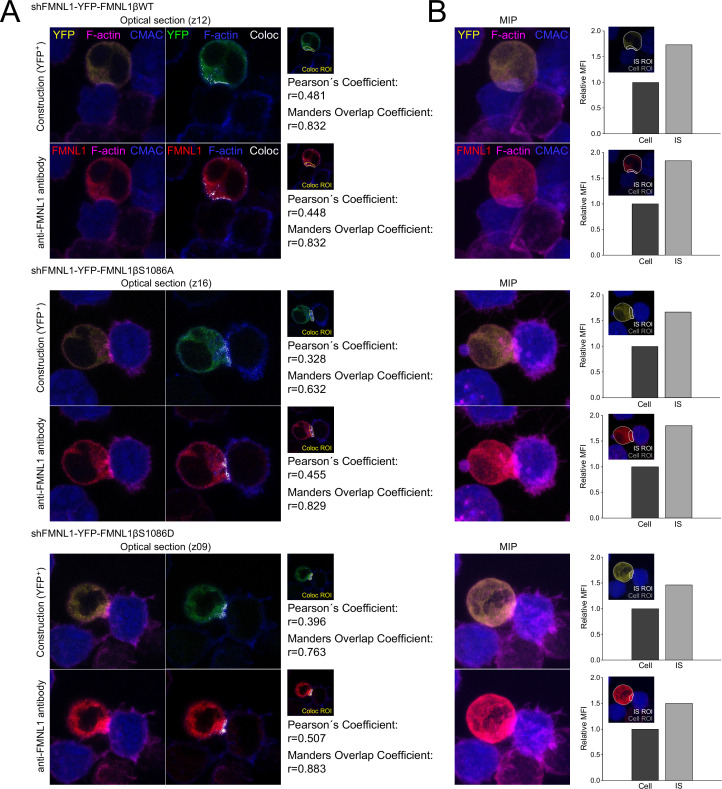
Figure 6—video 1. YFP-FMNL1βWT is recruited to the immune synapse (IS) independently of protein kinase C δ (PKCδ).
Download video file (131.8KB, mp4)
YFP-FMNL1βWT-expressing, C3 control clone cells (upper panel) and PKCδ-interfered P5 cells (lower panel) were mixed with CMAC-labeled, SEE-pulsed Raji cells (blue) attached to slides as described in Materials and methods. Subsequently, the conjugates were imaged by time-lapse microscopy (7 fps) for the indicated times. In both panels, CMAC (blue) and YFP-FMNL1βWT (yellow) channels were merged (see Figure 6). This video is related to Figure 6.