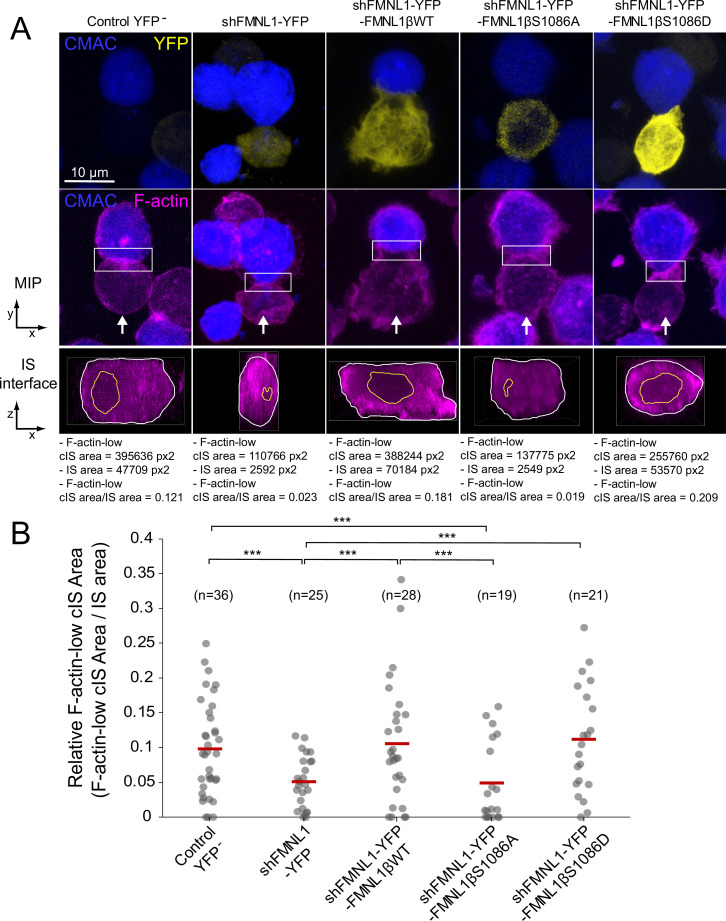
Figure 7. FMNL1β phosphorylation at S1086 regulates the F-actin architecture of the immune synapse (IS).
C3 control clone was untransfected (Control YFP-) (first column) or transfected with FMNL1-interfering (shFMNL1-HA-YFP) (second column), FMNL1-interfering expressing interference-resistant YFP-FMNL1βWT (shFMNL1-HA-YFP-FMNL1βWT) (third column), YFP-FMNL1βS1086A (fourth column), or YFP-FMNL1βS1086D (fifth column) constructs. Subsequently, cells were challenged with CMAC-labeled, SEE-pulsed Raji cells (blue) for 1 hr, fixed, stained with phalloidin AF647 (magenta) to label F-actin, and imaged by confocal microscopy. (A) The upper rows display the top, yx views corresponding to the maximum intensity projection (MIP) images of the specified, merged channels of a representative example from each of the indicated cell groups. White arrows indicate the direction to visualize the en face views of the IS (IS interface) enclosed by the regions of interest (ROIs) (white rectangles), as shown in Figure 7—video 1. In the lower panels, the enlarged ROIs (2× zoom) used to generate the IS interface, zx images of each cell group are shown. The areas of the F-actin-low region at the central region of the IS (cIS) (Fact-low cIS area) (yellow line) and the synapse (IS area) (white line) were defined and measured as indicated in Materials and methods, and the relative area of the F-actin-low region at the cIS (Fact-low cIS area/IS area) was calculated and represented. (B) Relative area (Fact-low cIS area/IS area) dot plot distributions and average area ratios (red horizontal lines) for the indicated number of IS conjugates developed by each cell group are shown. This figure is related to Figure 7—video 1. NS, not significant; ***, p≤0.05. Results are representative of data from several independent experiments (n=3) with similar results.

