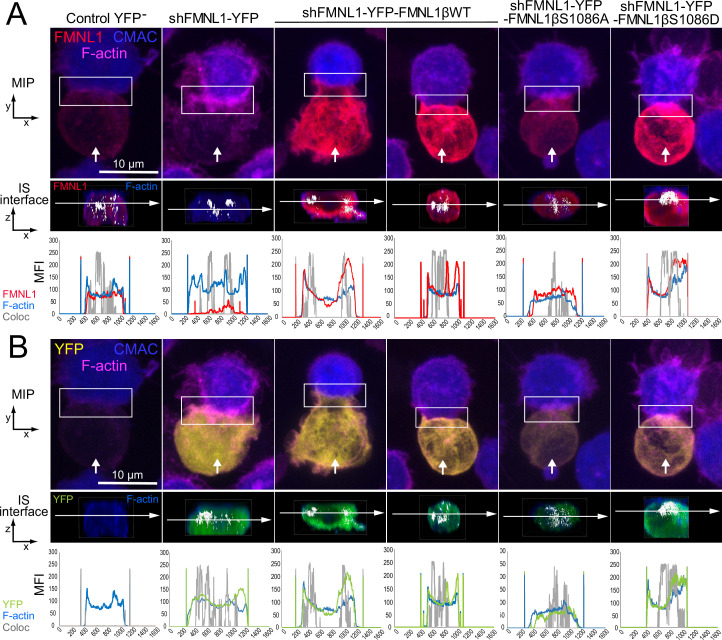
Figure 8. Three-dimensional distribution and colocalization of FMNL1 and F-actin at the immune synapse (IS) interface.
C3 control clone was untransfected (Control YFP-) (first column) or transfected with FMNL1-interfering (shFMNL1-HA-YFP) (second column), FMNL1-interfering expressing interference-resistant YFP-FMNL1βWT(shFMNL1-HA-YFP-FMNL1βWT) (third and fourth column), YFP-FMNL1βS1086A (fifth column) or YFP-FMNL1βS1086D (sixth column) constructs. Subsequently, cells were challenged with CMAC-labeled SEE-pulsed Raji cells (blue) for 1 hr, fixed, and stained with phalloidin (magenta) and anti-FMNL1 (red). The corresponding shFMNL1 construction is in yellow, and synaptic conjugates were imaged by confocal fluorescence microscopy. Please realize that for the IS interface and since interface colocalization in NIS-AR only works with red, green, and blue channels, F-actin (acquired in magenta) was changed to blue color, and YFP (acquired in yellow) was changed to green in the second row of each panel. (A) The upper row includes top, yx views corresponding to the maximum intensity projection (MIP) images of representative examples of each cell group. Vertical white arrows indicate the direction to visualize the en face views of the IS (IS interface) enclosed by the regions of interest (ROIs) (white rectangles), as shown in Figure 8—video 1. In the second row, the enlarged ROIs (2× zoom) used to generate the IS interface, zx images of each cell group are shown. Subsequently, interface colocalization pixels (white) were generated by merging the indicated channels in the second row of each panel (F-actin in blue merged to anti-FMNL1 in red), at the IS interfaces of the synaptic areas (generated as shown in Figure 8—video 1). The last frame of these videos corresponds to the en face view (interface) (second row in both panels). Mean fluorescence intensity (MFI) profiles along the indicated line (horizontal white arrow) of each separate channel (F-actin in blue, anti-FMNL1 in red) and the colocalization pixels (gray) are shown below the IS interfaces. (B) Same as (A), but the top views show YFP-expressing constructs signal instead of the anti-FMNL1 signal. The IS interfaces and the MFI profiles show F-actin (magenta changed to blue) and YFP (yellow changed to green). This figure is related to Figure 8—video 1. At least six synapses of each cell group were analyzed. Results are representative of data from several independent experiments (n=3) with similar results.


