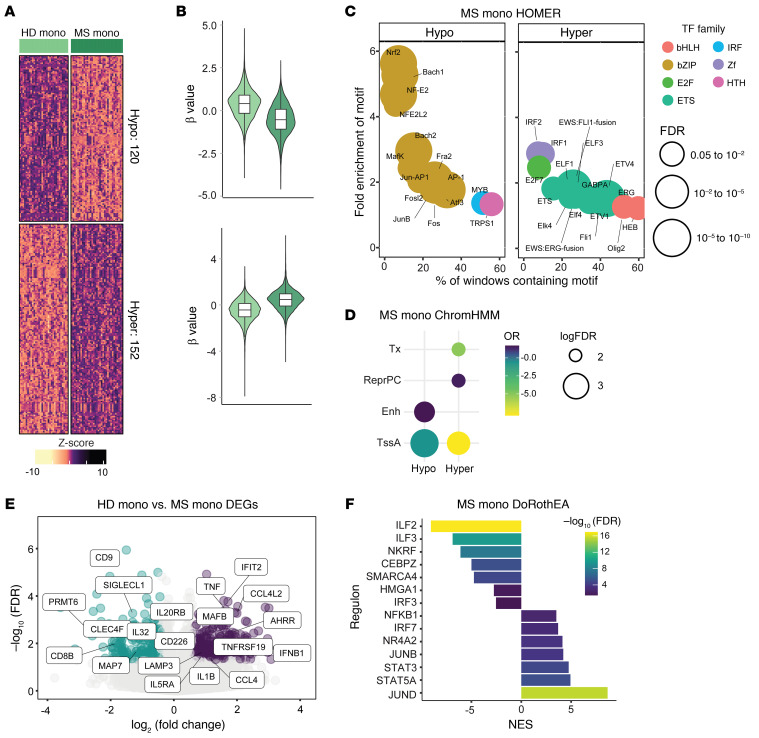
Figure 2. Multiomic characterization of peripheral CD14+ cells in MS patients and HDs.
(A) DNA methylation heatmap of 18 versus 18 samples of HD and MS monocytes (mono). The heatmap includes all CpG-containing probes displaying significant methylation changes (differentially methylated positions [DMPs]) (FDR < 0.05, β > 0.05) in the HD mono–MS mono contrast. (B) Violin plots showing the general distribution of DNA methylation across clusters of hyper- or hypomethylation in the HD mono–MS mono contrast. Clear green violin plots correspond to HD mono; dark green violin plots correspond to MS mono. (C) Bubble scatterplot showing HOMER analysis of significantly enriched transcription factor (TF) motifs in hypermethylated and hypomethylated cluster regions in HD–MS mono contrast. The x axis shows percentage of windows containing the motif, while the y axis shows fold enrichment of the motif over background. Colors of bubbles indicate different TF families, while their size is proportional to the FDR. (D) Chromatin functional state enrichment analysis of differentially hyper- and hypomethylated probes in the HD mono–MS mono contrast based on ChromHMM public data on CD14+ primary cells from the Roadmap Epigenomics project. Odds ratio (OR) is reported on a color scale; sizes of bubbles are proportional to log of FDR. Significantly enriched categories are shown (FDR < 0.05, OR > 2), including strong transcription (Tx), repressed Polycomb (ReprPC), enhancers (Enh), and active transcription starting site (TssA). (E) Volcano plots of gene expression showing HD mono–MS mono contrast, with binary logarithm of fold change on the x axis and negative decimal logarithm of FDR on the y axis. Differentially downregulated and upregulated genes are shown if FDR < 0.05 and fold change < –0.5 or > 0.5. (F) Bar plot depicting TF activity predicted from mRNA expression of target genes with DoRothEA v2.0 in the HD–MS mono contrast in terms of normalized enrichment score (NES). Regulons with a high confidence score of A–B were analyzed. A and B refer to benchmarked dataset of curated lists of regulons (list A and list B). A and B are the ones with highest confidence that were used here to estimate transcription factor activity (107). Cases with P < 0.05 and NES > 2 and NES < 2 were considered significantly enriched.

