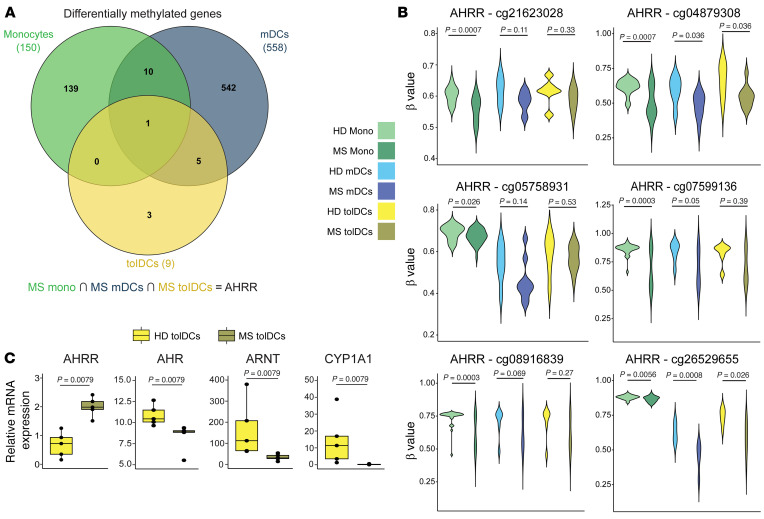
Figure 5. MS Mono, mDCs, and tolDCs share alterations in the AHR pathway.
(A) Venn diagram showing shared hyper- and hypomethylated genes linked to significant differential methylation changes (DMPs) across HD-MS contrasts, in different cell types (MS mono, MS mDCs, and MS tolDCs). (B) Violin plots showing DNA methylation levels (β values) of AHRR individual CpGs in hypermethylated and hypomethylated sets across all 3 comparisons. P values correspond to FDR (significant if FDR < 0.05). (C) Box plots of relative expression of individual genes performed by reverse transcriptase qPCR (RT-qPCR) of mRNA in HD tolDCs–MS tolDCs. P values from Mann-Whitney tests are shown. n = 5 per sample group, 2 independent experiments.

