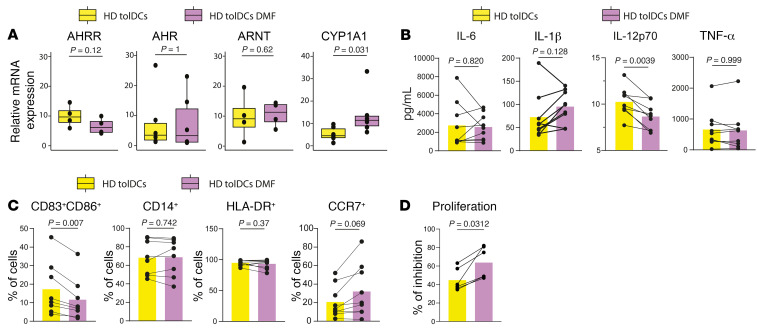
Figure 7. In vitro DMF supplementation increases VitD3-tolDC tolerogenicity.
(A) Box plots of relative expression of individual genes performed by RT-qPCR of mRNA in HD tolDCs versus HD tolDCs + DMF. DMF was added at day 0 and day 4 of differentiation of tolDCs, with a final concentration of 10 μM. P values from Wilcoxon’s tests are shown. n = 4–6 depending on the gene analyzed. (B) Before-after scatter bar plot representing the effect of DMF on production of IL-6, IL-12p70, and IL-1β cytokines by tolDCs. TolDC HD data were already presented in Figure 3F. P values from Wilcoxon’s tests are shown. n = 9 in each sample group. (C) Before-after scatter bar plot showing flow cytometry data relative to the percentage of CD83+CD86+, CD14+, HLA-DR+, and CCR7+ cells among HD tolDCs and HD tolDCs DMF. P values from Wilcoxon’s tests are shown. n = 8 per sample group. (D) Proliferation of allogeneic peripheral mononuclear cells cocultured with HD tolDCs and HD tolDCs DMF. Inhibition of proliferation was assessed as described earlier. P values from Wilcoxon’s tests are shown. n = 6 per sample group.

