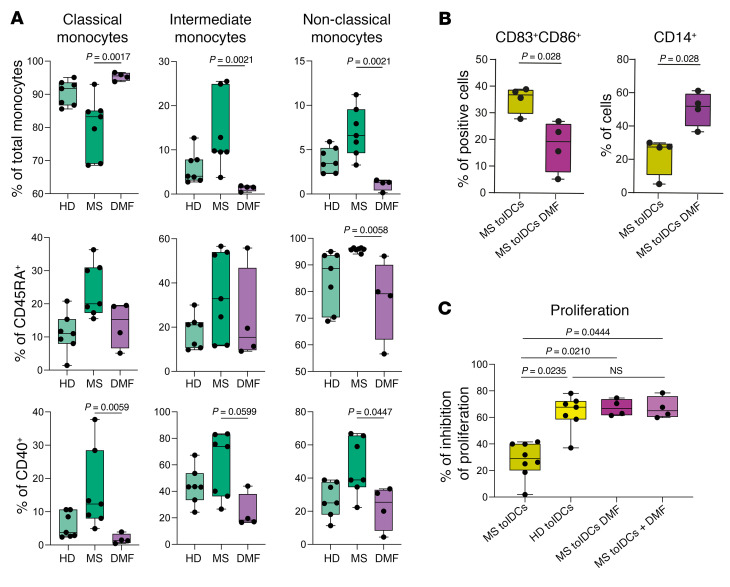
Figure 9. In vivo administration of DMF to MS patients restores fully functional tolDCs.
(A) Box plots reporting percentages of classical, intermediate, and non-classical monocytes among HD and MS patients without treatment (MS) or treated with DMF (DMF), with respect to total monocytes as parent gate (top row), or reporting percentages of CD45RA+ (middle row) or CD40+ (bottom row) classical, intermediate, and non-classical monocytes. P values from Kruskal-Wallis test with Dunn’s multiple comparisons are shown. n = 7 or n = 4 depending on the sample group. Percentages of monocyte subpopulations from HD and MS patient groups are also presented in Figure 1B. Here, new statistical tests have been applied to include a cohort of DMF-treated patients. (B) Box plots showing flow cytometry data relative to the percentage of CD83+CD86+ and CD14+ cells after 6-day in vitro differentiation among MS tolDCs and among tolDCs isolated from patients undergoing DMF treatment (MS tolDCs DMF). Unpaired, 2-tailed t tests were used to calculate P values (Mann-Whitney tests). n = 4 in each sample group. (C) Proliferation of allogeneic PBMCs with tolDCs from HDs, treatment-naive MS patients (MS tolDCs), or patients undergoing DMF treatment (MS tolDCs DMF) or with tolDCs from MS patients differentiated in the presence of DMF in vitro (MS tolDCs + DMF). Inhibition of proliferation was assessed as described earlier. One-way ANOVA with multiple comparisons was used to calculate significant differences among groups (Kruskal-Wallis test), reported as P values. n = 4–8 depending on the sample group.

