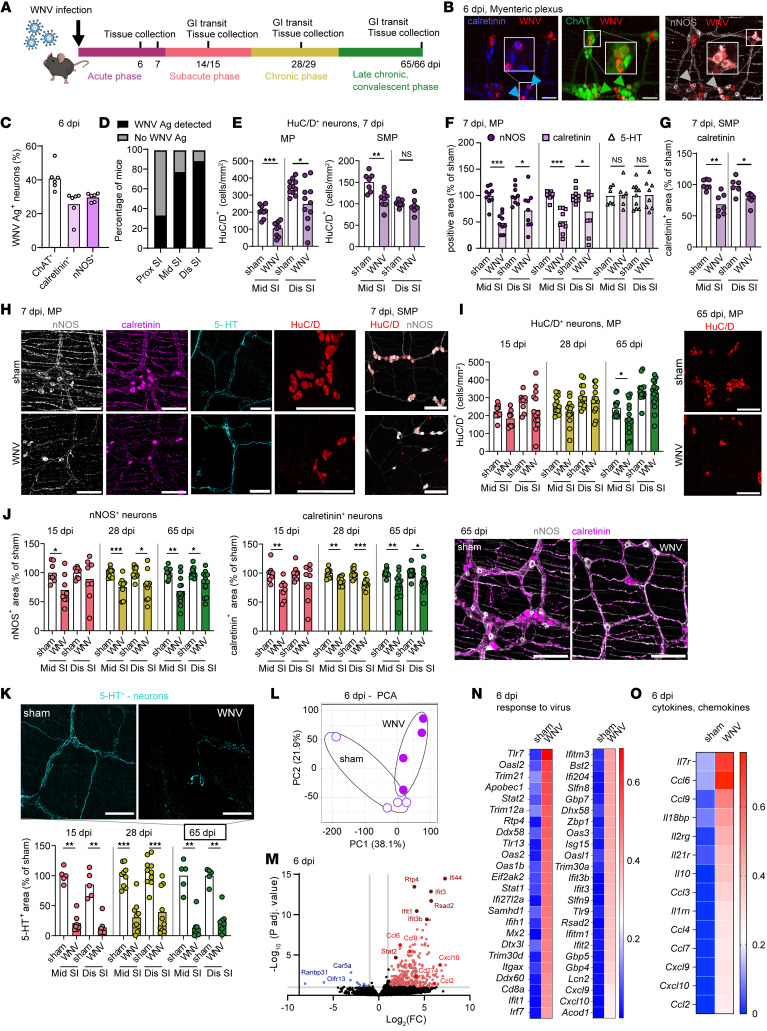
Figure 1. WNV infection induces changes in ENS neuronal networks.
(A) Nine- to 10-week-old C57BL6/J male mice were inoculated in the footpad with 102 FFU WNV (New York 1999 strain), and a carmine dye transit assay and tissue collections were done at the indicated time points. The figure in A was created using BioRender software. (B and C) Whole-mount preparations of the muscularis externa from ChAT-eGFP reporter mice were isolated at 5 or 6 dpi and costained for WNV antigen, calretinin+, and nNOS+ neurons. (B) Blue, green, and white arrowheads indicate WNV antigen+ calretinin+ neurons, ChAT+ neurons, and nNOS+ neurons, respectively. Images are representative of 2 experiments. Scale bars: 50 μm. (C) Proportion of neuronal subgroups infected with WNV. (D) Percentage of mice that had WNV antigen (Ag) in the proximal (Prox), middle (Mid), and distal (Dis) regions of the small intestine (SI) at 6 dpi. (E–K) The muscularis externa with the attached layer containing the submucosal plexus (SMP) (G), the myenteric plexus (MP) (F and I–K), or both the myenteric plexus and submucosal plexus, as indicated (E and H), was isolated from the middle and distal small intestine of sham- and WNV-infected mice at 7 dpi (E–H) or at 15, 28, and 65 dpi (I–K) and stained for neuronal markers. (E and I) The total number of HuC/D+ neurons in (E) the submucosal plexus and myenteric plexus and (I) the myenteric plexus only was counted and is shown as the number of neurons per mm2. (F and G) The fraction of area that stained positively for nNOS, calretinin, and 5-HT in the myenteric plexus (F) or for calretinin in the submucosal plexus (G); values were normalized to those for sham-infected mice. Circles, squares, and triangles indicate nNOS+, calretinin+, and 5-HT+ neurons, respectively. (H) Images show staining for the indicated markers in the middle small intestine from sham- and WNV-infected mice at 7 dpi in either the myenteric plexus or the submucosal plexus. Scale bars: 100 μm. (J) nNOS+ and calretinin+ and (K) 5-HT+ cell areas; values were normalized to those for sham-infected mice. (I–K) Images show staining in the middle small intestine from sham- and WNV-infected mice at 65 dpi. Scale bars: 100 μm. (L–O) Analysis of neuron-specific RNA-Seq using TRAP in WNV- or mock-infected Snap25l10a mice at 6 dpi. (L) Principal component analysis (PCA). (M) Volcano plot of differential expression analysis (DEseq2) of translating ribosome affinity purification sequencing (TRAP-Seq) comparing WNV- and mock-infected samples. Red dots indicate a log2 fold change of greater than 1 and a FDR (P-adjusted) of less than 0.05, and blue dots indicate a log2 fold change of 1 or less and a P-adjusted FDR of less than 0.05. (N and O) Heatmap of differentially expressed genes in sham- and WNV-infected mice showing genes related to (N) the response to virus and (O) cytokines and chemokines. Expression levels were normalized across each gene and represent the average of 4 mice per condition. Data were pooled from the following number of experiments: (C and D) 2; (E–K) 3 (myenteric plexus) and 2 (submucosal plexus); (F) 3; (G) 2, (I) 3; (J) 2 (15 dpi), 3 (28 dpi), and 4 (65 dpi); and (K) 2 (15 dpi), 3 (28 dpi), and 2 (65 dpi). The numbers of mice per group were as follows: (C) n = 6; (D) n = 9; (E) n = 7–11; (F) n = 6–10; (G) n = 6–7; (I) n = 9–16; (J) n = 8–13; (K) n = 5–10. Column heights in C, E–G, and I–K indicate mean values. *P < 0.05, **P < 0.01, and ***P < 0.001, by 2-tailed Mann-Whitney U test.

