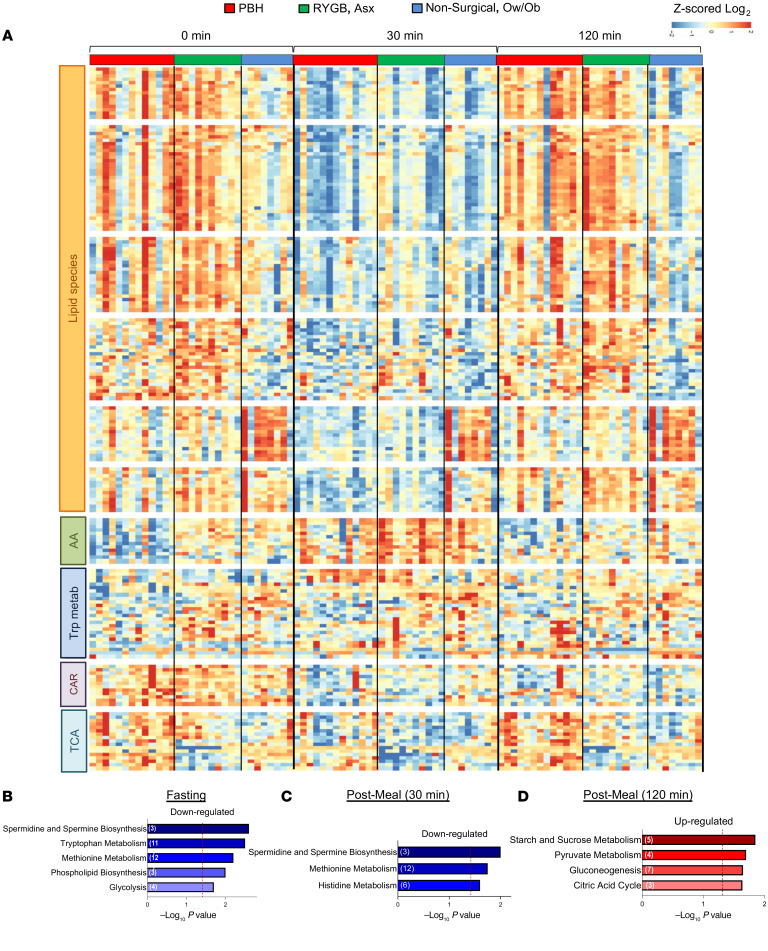
Figure 1. Metabolite abundance in individuals with PBH, Asx, and Ow/Ob in the fasting state and at 30 and 120 minutes after mixed meal ingestion.
(A) Heatmap of z-scored log2-transformed metabolite abundance for the top 190 most altered metabolites between groups, with unsupervised hierarchical clustering of rows. Cluster annotations include lipid species (clusters 1–6), amino acids (AA; cluster 7), tryptophan metabolites (cluster 8), carnitines (CAR; cluster 9), and tricarboxylic acid (TCA) cycle metabolites (cluster 10). (B–D) Pathway enrichment analysis for PBH versus Asx individuals in the fasting state and 30 and 120 minutes after meal ingestion, respectively. Downregulated pathways are colored blue, while upregulated pathways are colored red. The –log10 P value for enrichment is represented on the x axis; the vertical line indicates nominal P less than 0.05.

