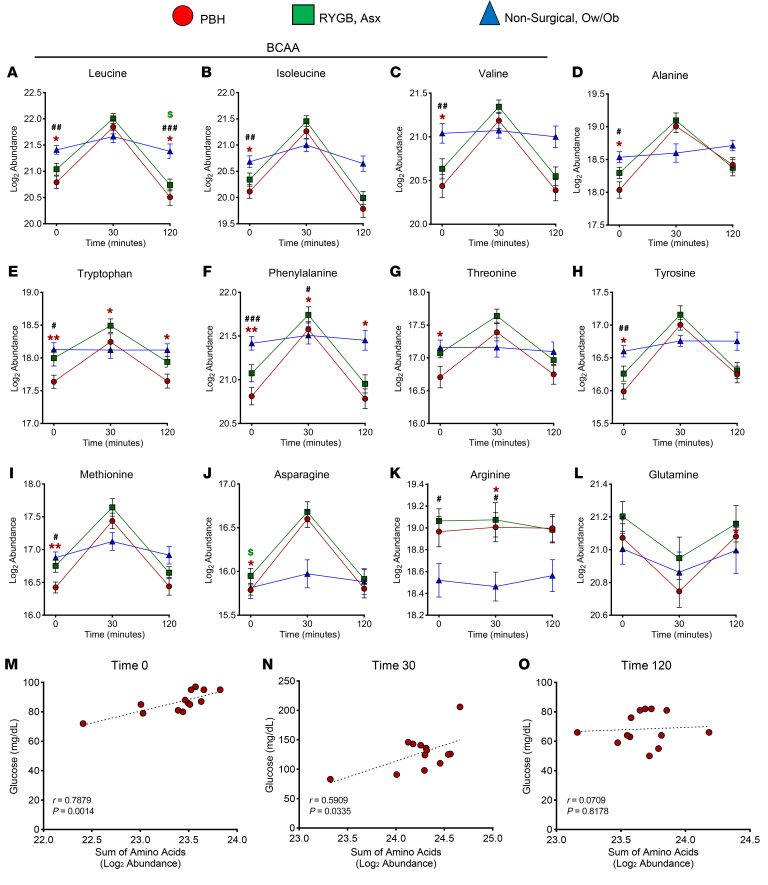
Figure 3. Abundance of 12 plasma AAs in PBH, Asx, and Ow/Ob individuals in the fasting state and at 30 and 120 minutes after mixed meal ingestion.
(A–L) Abundance of leucine (A), isoleucine (B), valine (C), alanine (D), tryptophan (E), phenylalanine (F), threonine (G), tyrosine (H), methionine (I), asparagine (J), arginine (K), and glutamine (L). (M–O) Correlation between glucose levels and sum of AA abundance in the fasting state (red, M) and at 30 minutes (red, N) and 120 minutes (red, O) after meal. Data are mean ± SD. *,#,$P < 0.05; **,##P < 0.01; ###P < 0.001. Two-way ANOVA with Tukey’s multiple-comparison test was performed.

