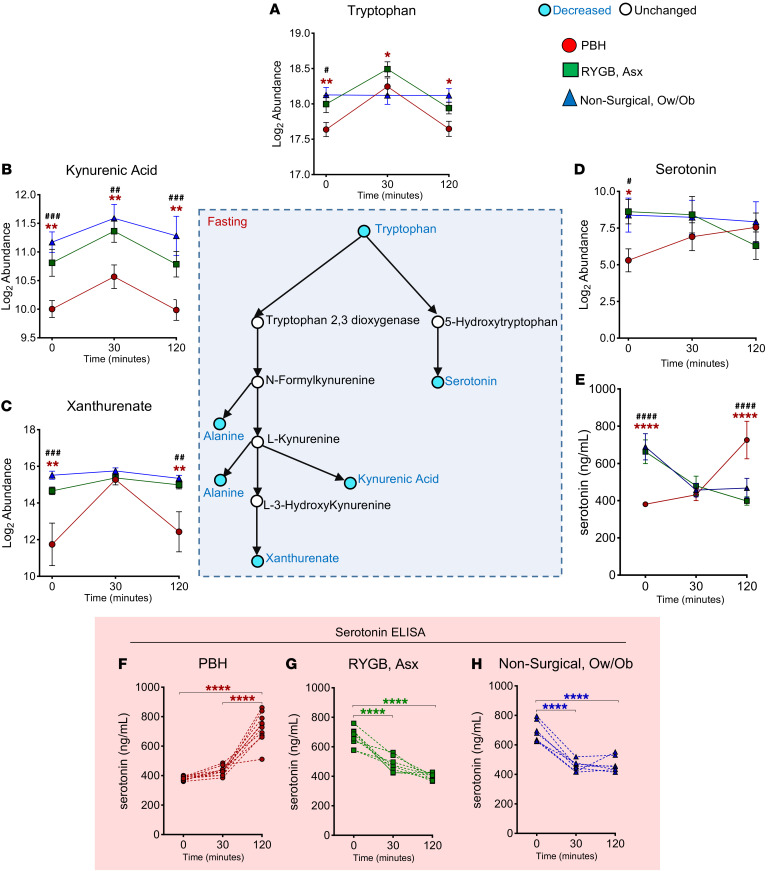
Figure 4. Abundance of tryptophan, tryptophan-derived metabolites, and serotonin in PBH, Asx, and Ow/Ob individuals in the fasting state and after mixed meal ingestion.
Center: Schematic of tryptophan metabolism and downstream metabolites. (A–E) Abundance of tryptophan (A), kynurenic acid (B), xanthurenate (C), serotonin (D), and serotonin by ELISA (E). (F–H) Serotonin ELISA of individual participants in PBH (red), Asx (green), and Ow/Ob (blue) groups. Data are mean ± SD. *,#P < 0.05; **,##P < 0.01; ###P < 0.001;****P < 0.0001 for PBH vs. Asx; ####P < 0.0001 for PBH vs. Ow/Ob. Two-way ANOVA with Tukey’s multiple-comparison test was performed. Blue color of circles in the schematic indicates metabolites with decreased abundance, while white indicates unchanged abundance.

