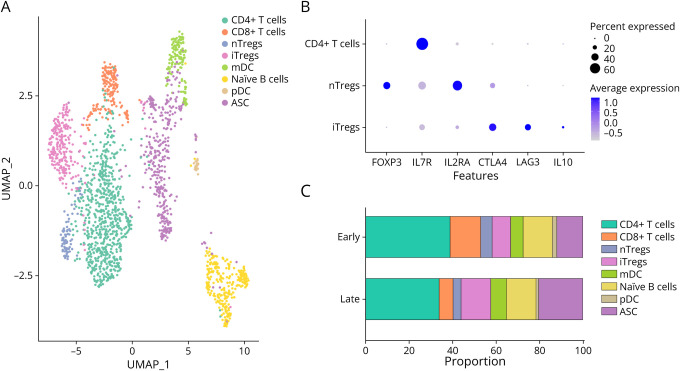
Figure 1. CSF Immune Milieu Is Diverse During SANCC Treatment.
(A) CSF cells collected from 5 patients with SANCC were merged and surveyed using scRNA. Colors denote different cell populations identified using reference databases and canonical markers. (B) 2 populations of CD4+ Tregs were observed in the CSF: nTregs and iTregs. These were isolated as a subset of CD4+ T cells. Canonical Treg-associated features are displayed on the x-axis with percent and average expression portrayed by shape size and color intensity. (C) Samples were collected from 5 patients; 3 patients provided samples at both the early and late time points while 2 provided samples at a single time point. With 4 samples in each group, aggregate scRNA analysis demonstrated shifts in CSF cell populations over the course of treatment with an observed expansion of iTregs, mDCs, and ASCs. Colors parallel those in panel A. ASCs = antibody-secreting B cells; iTregs = induced regulatory T cells; mDC = myeloid dendritic cell; nTregs = natural regulatory T cells; pDC = plasmacytoid dendritic cell; SANCC = subarachnoid neurocysticercosis; scRNA = single-cell RNA sequencing.

