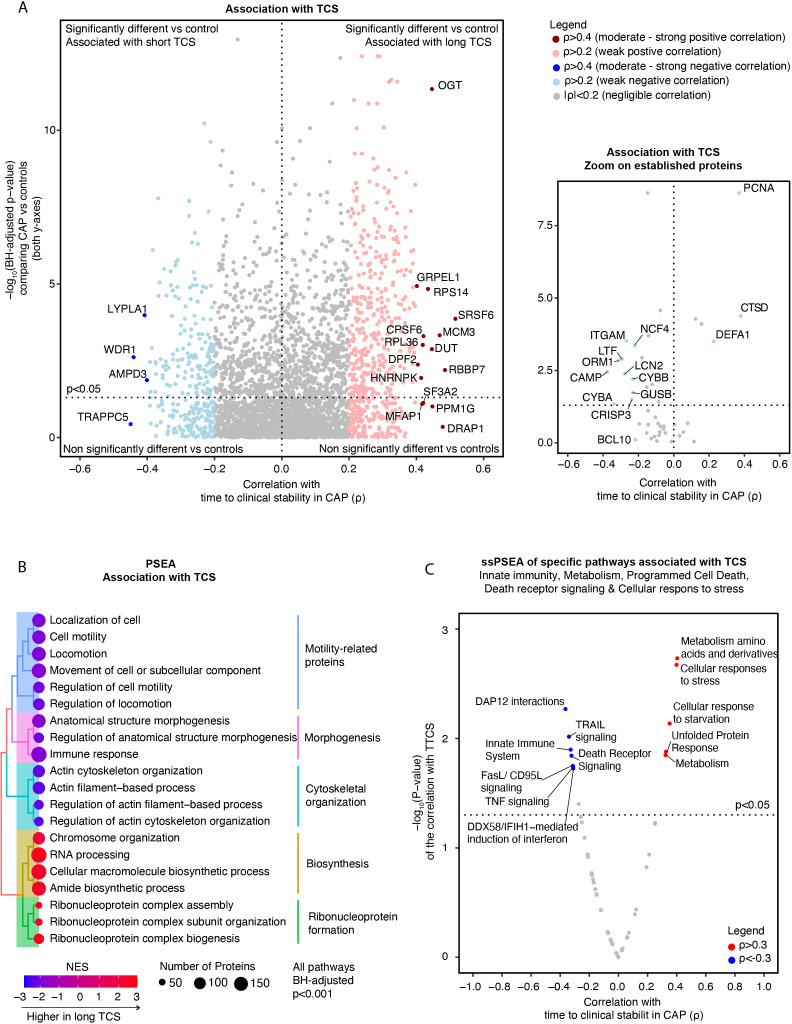
Figure 2.
Association of neutrophil proteome in community-acquired pneumonia (CAP) patients with time to clinical stability. (A) Left panel; Comprehensive quadrant plot depicting the association of proteins with time to clinical stability (TCS) in CAP patients. The x-axis denotes the strength of the correlation between the protein and TCS in CAP patients derived from Spearman’s correlation test. The significance of the differences in protein abundance between CAP patients and controls was plotted on the y-axis (in line with Figure 1C ) to facilitate interpretation. The top 20 proteins with the strongest association with TCS were labeled. Right panel: Focused Quadrant plot featuring established neutrophil proteins. This panel serves to highlight these key proteins, which are also present but unlabeled in the left panel due to their lower correlation values. (B) Results of an untargeted pathway analysis of proteins ranked by the strength of their Spearman’s correlation with TCS in CAP using the Gene ontology (GO) Biological Process database (31). The top 20 pathways with the strongest association with TCS were displayed and clustered based on the similarity of proteins in each pathway using Ward’s clustering and the Enrichment plot R-package (33). Normalized Enrichment Scores (NES) were used to quantify the magnitude. (C) Single Sample Protein Set Enrichment Analysis (ssPSEA) using the Reactome ssGSEA plugin and database in which we explored specific neutrophil-related pathways (32). The individual pathway expression values for each patient, based on the protein abundance in that patient, were correlated to TCS using a Spearman’s correlation test unadjusted for multiple testing.

