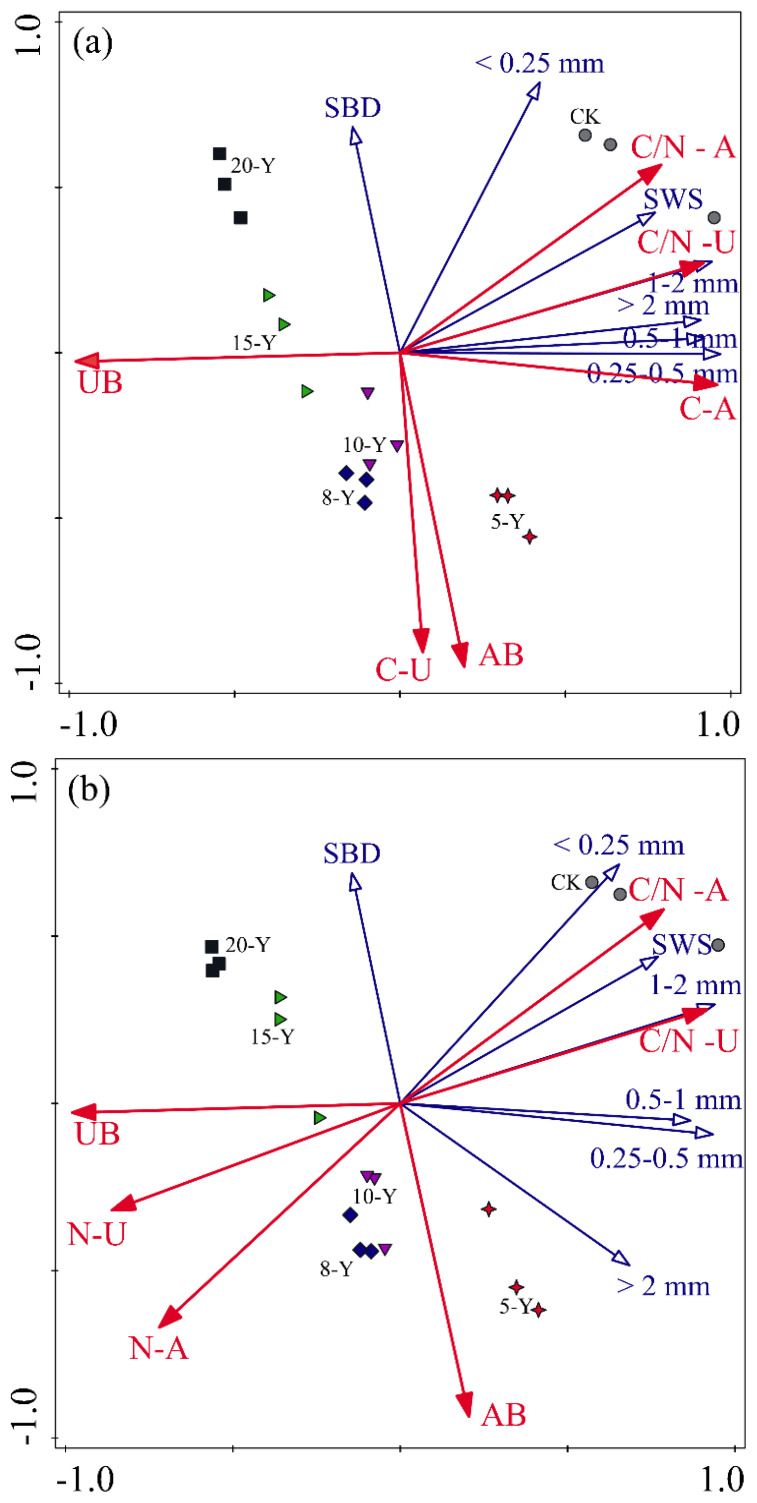
Figure 5.
RDA biplot based on biomass and C and N concentrations of alfalfa plant variables in all treatments under different size aggregates C (A) and N (B) stocks. CK, abandoned farmland. 5-Y, 8-Y, 10-Y, 15-Y, and 20-Y represent planting variations for 5, 8, 10, 15, and 20 years, respectively, AB, aboveground biomass; UB, underground biomass; C-A, carbon concentration of alfalfa aboveground plant; C-U, carbon concentration of alfalfa underground plant; N-A, nitrogen concentration of alfalfa aboveground plant; N-U, carbon concentration of alfalfa underground plant; C/N-A, carbon-nitrogen ratio of alfalfa aboveground plant; C/N-U, carbon-nitrogen ratio of alfalfa underground plant; SBD, soil bulk density; SWS, soil water storage.

