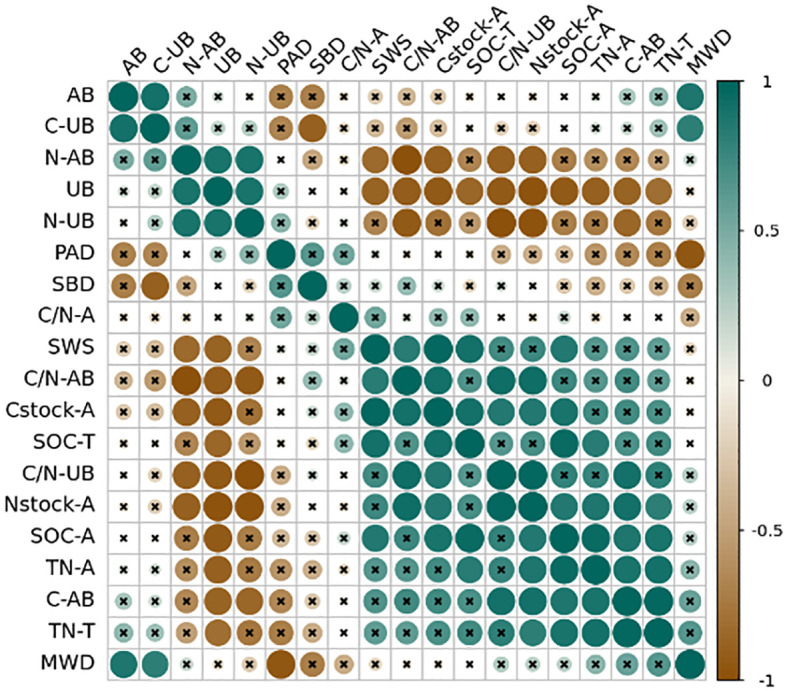
Figure 6.

Correlation matrix of the study variables. Color and the size of the circles are proportional to the correlation coefficients between the variables. SWS is soil water storage, SBD is soil bulk density, SOC-T is surface soil organic carbon content of 0-cm to 20-cm depth, TN-T is surface soil total nitrogen content of 0-cm to 20-cm depth, MWD is the mean weight diameter, PAD is the percentage of aggregate destruction, SOC-A is the average SOC content of five size aggregates, TN-A is the average TN content of five size aggregates, Cstock-A is the sum of SOC stock in the five size aggregates, Nstock-A is the sum of TN stock in the five size aggregates, AB is the aboveground biomass, UB is the underground biomass, C-AB is the SOC content of aboveground plant, C-UB is the SOC content of root, N-AB is the TN content of aboveground plant, N-UB is the TN content of root, C/N-AB is the C/N content of aboveground plant, C/N-UB is the C/N content of root. The values in the figure represent correlation coefficients.
