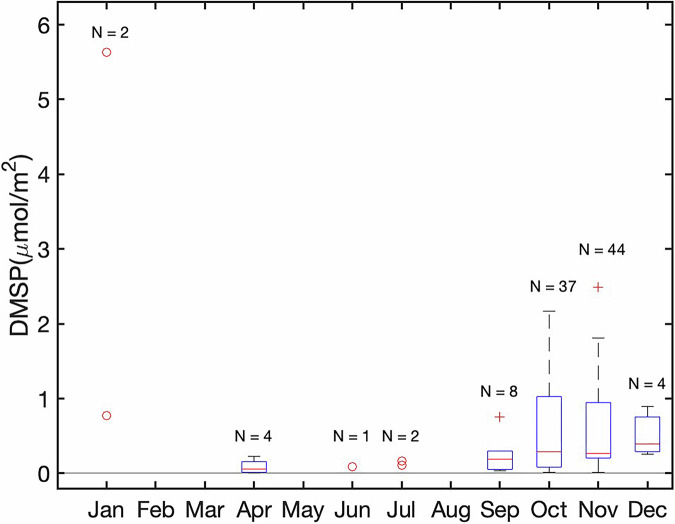
Fig. 1.
Temporal analysis of DMSP sea-ice core data in this dataset. The boxplot shows the range of DMSP concentrations for all depth-integrated ice cores against the month in which they were collected. Boxes represent the interquartile range of DMSP concentrations, with lower and upper whiskers showing the nonoutlier minima and maxima, respectively, red lines showing the medians, and the symbol (+) representing the outliers. The thin grey horizontal line marks the DMSP values at 0. Months with insufficient data points are plotted with dots. Sample size for each month is shown as N.

