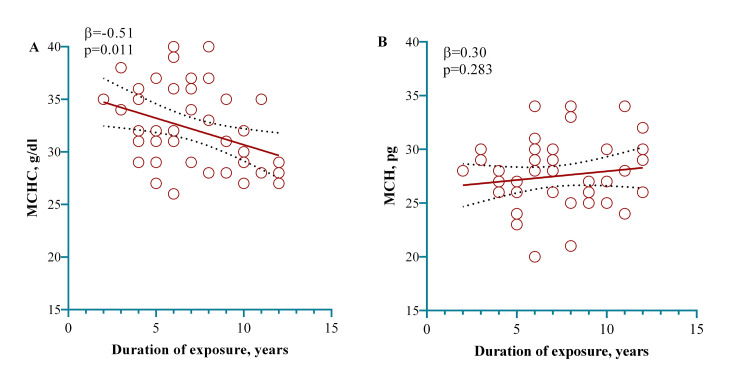
Figure 4. A model showing that one year of exposure working in a cement factory significantly decreased the MCHC. The relationship (linear) between contact with the dust of cement and MCHC (A) and MCH (B) was examined here. The indication of relationship linearity is shown employing the dots in red, in which individual observations are represented by the dots in red. Calculating the p-value was done using a multivariate regression model adjusting for age and BMI (categorical) in the regression model.
MCHC: mean corpuscular hemoglobin concentration; MCH: mean corpuscular hemoglobin; BMI: body mass index.

