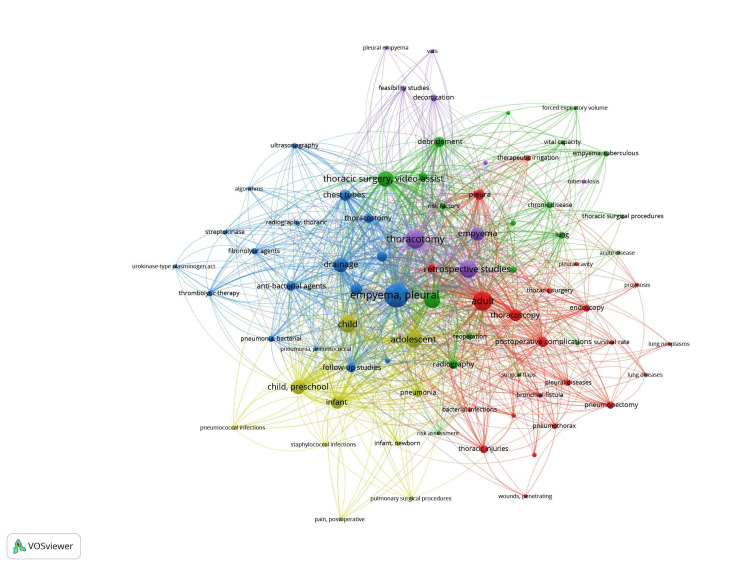
Figure 7. VOSviewer visualization of keyword occurrences and co-occurrences in research on early thoracotomy and decortication for pleural empyema.
Each node represents a research term and highlights the specific aspect/focus of the research. The node size shows the importance or frequency of each term. Larger nodes represent terms that appear more frequently and/or are more central to the network, and the node colors represent groups/clusters of related terms based on their co-occurrence.
Blue cluster: management strategies in empyema; red cluster: adult thoracic conditions, treatment, prognosis, and postoperative complications; green cluster: empyema, assessments, surgical/treatment procedures; yellow cluster: pediatric infections and management; purple cluster: surgical techniques in empyema.
The lines between nodes generally represent co-occurrence relationships between terms, and their color typically corresponds to the cluster to which the connecting terms belong. For example, blue lines connect terms in the blue cluster. Therefore, the color of the lines can be interpreted similarly to the color of the clusters. Lines that connect nodes across different clusters have a blended or mixed color appearance. For example, a line connecting a term from the Blue Cluster to a term from the Purple Cluster may show how empyema co-occurs with thoracotomy and retrospective studies. The thickness of the line shows how frequently these terms co-occur or the strength of the relationship between terms based on co-occurrence. Thicker lines indicate a stronger relationship or more frequent co-occurrence between the terms. Thinner lines represent weaker or less frequent connections.
(Image Credits: Dr. Vishal V. Bhende)

