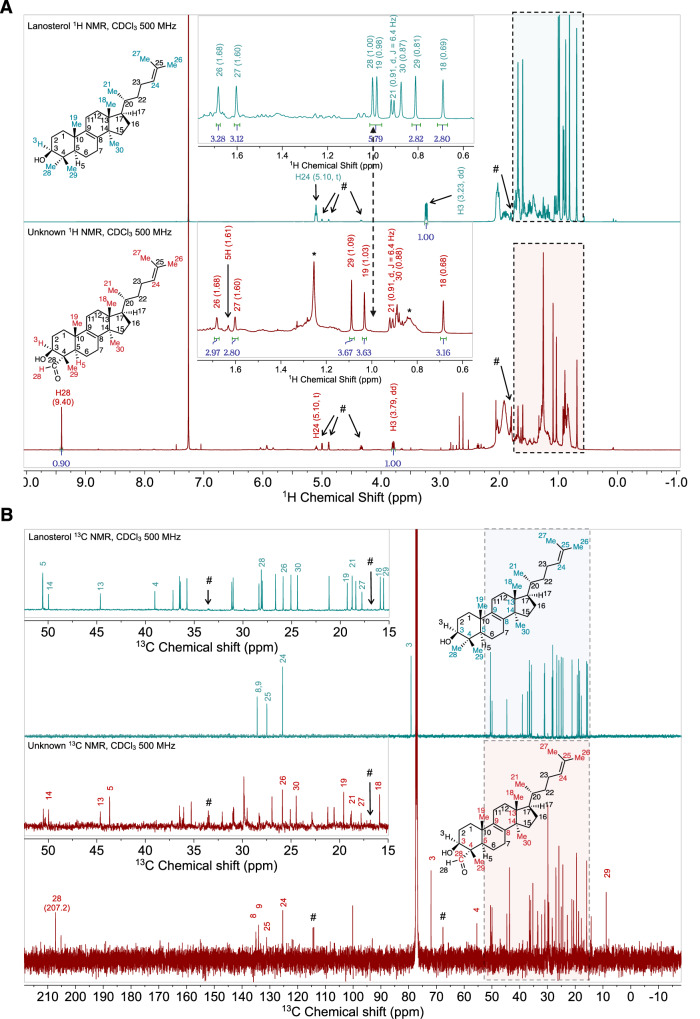
Fig. 3. 1D NMR spectra of the purified metabolite (unknown) of lanosterol from incubations with CYP5122A1.
1H (A) and 13 C (B) NMR spectral comparison between lanosterol (reference) and the purified metabolite indicating the presence of the aldehyde group in the purified metabolite. Hashtags (#) indicate signals of an impurity present in both the lanosterol standard and the unknown sample (see Supplementary Fig. 7 and Supplementary Table 3 for chemical shifts and proposed partial structure of this impurity). Asterisks (*) indicate signals of grease contamination (broad peak at 1.26 ppm and the multiplet at 0.86 ppm).

