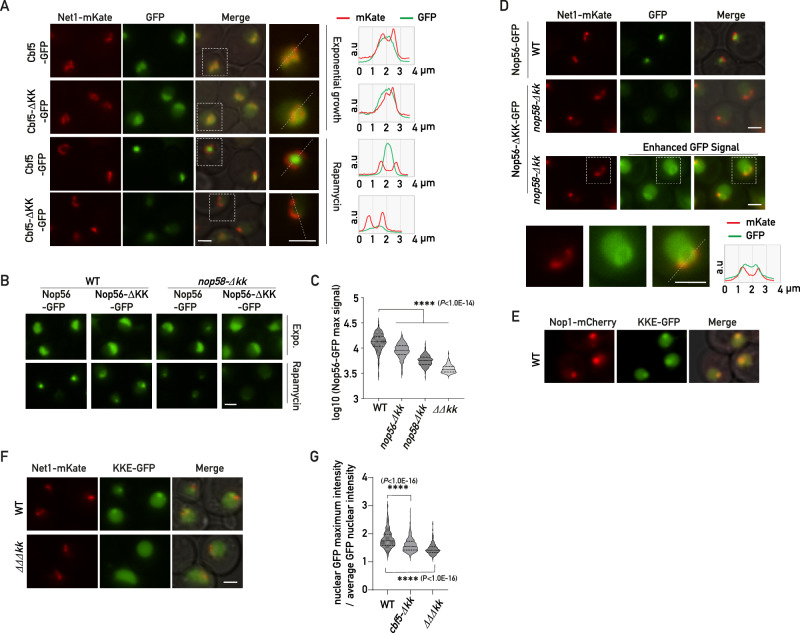
Fig. 6. KKE/D domains are essential for nucleolar compaction and sequestration of associated factors in a specific subnucleolar area following TORC1 inactivation.
A Fluorescence microscopy analyses of CBF5-GFP and cbf5-Δkk-GFP cells expressing Net1-mKate grown exponentially (Exponential growth) or treated for 4 h with rapamycin (Rapamycin). Zooms of the indicated dotted square areas are shown on the right and average plots (right panel) show the signal profiles of mKate and GFP in the nucleolus along the indicated dotted lines. Scale bars = 2 μm. B Fluorescence microscopy analyses of wild-type (WT) or nop58-Δkk cells expressing Nop56-GFP or Nop56-ΔKK-GFP grown exponentially (Expo.) or treated for 4 h with rapamycin (Rapamycin). Scale bar = 2 μm. C Quantification of maximum nuclear GFP signals (Log10) of wild-type or nop58-Δkk cells inspected in (B) expressing Nop56-GFP (WT; n = 149 and nop58-Δkk; n = 149) or Nop56-ΔKK-GFP (WT; n = 149 and ΔΔkk; n = 112) treated for 4 h with rapamycin. p values were calculated with unpaired two-tailed Welch’s t test. n = number of cells pooled from 3 biologically independent replicates. D Fluorescence microscopy analyses of wild-type (WT) or nop58-Δkk cells expressing Nop56-GFP or Nop56-ΔKK-GFP or treated for 4 h with rapamycin. Net1-mKate allows localization of rDNA in the vicinity of the Nop56 condensate. Merge: overlay of both fluorescent signals. Bottom panel: 16-bit brightness levels have been increased to specifically visualize the GFP signal in nop56-Δkk-GFP nop58-Δkk cells in the vicinity of the Net1-mKate signal. Zooms of the indicated dotted square areas are shown below. Right panel: GFP and mKate average plot signals. Scale bars = 2 μm. E Wild-type (WT) cells expressing Nop1-mCherry and the KKE/D domain of Cbf5 fused to GFP (KKE-GFP) were analyzed by fluorescence microscopy. F Same legend as in (E) for rapamycin-treated wild-type (WT) or cbf5-Δkk nop56/58-ΔΔkk (ΔΔΔkk) cells expressing Net1-mKate and KKE/D-GFP (KKE-GFP). Scale bar = 2 μm. G Quantification of maximum nuclear GFP signals (maximum intensity divided by average intensity) in rapamycin-treated wild-type (WT; n = 373), cbf5-Δkk (n = 249) or cbf5-Δkk nop56/58-ΔΔkk (ΔΔΔkk; n = 161) cells expressing the KKE/D-GFP construct. p-values were calculated and indicated as in (C). n = number of cells pooled from 3 biologically independent replicates. Source data are provided as a Source data file.

