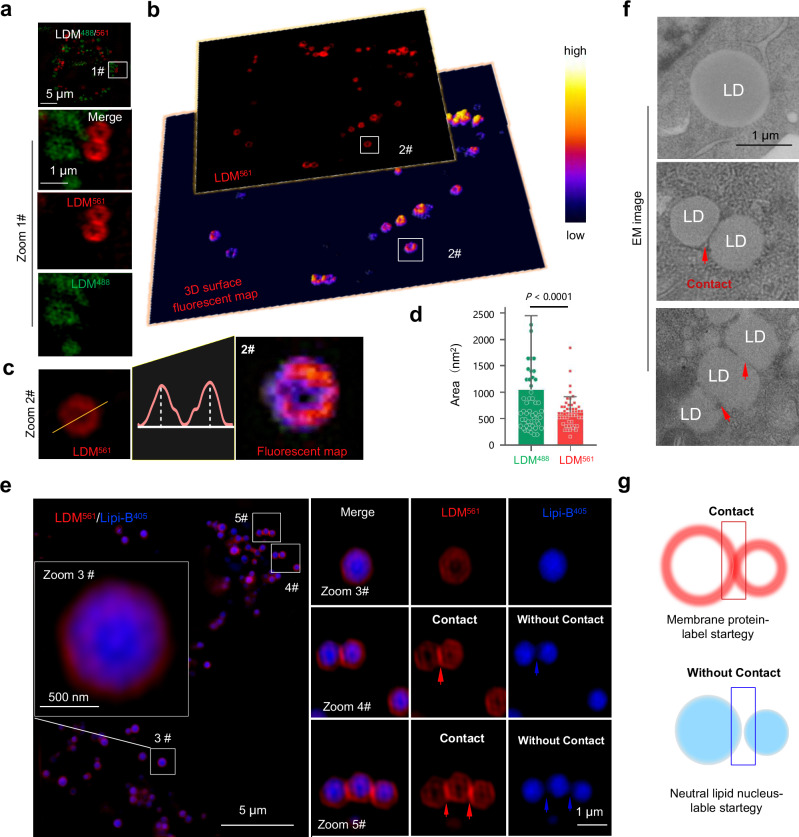
Fig. 3. Super-resolution imaging for ring-like LD membrane tracking with LDM pro-probe.
a HepG2 cells incubated with 10.0 μM LDM under SIM 488 laser and 561 laser, Zoomed-in images are of white rectangle #1. b 3D surface fluorescent map of HepG2 cells incubated with LDM under SIM 561 laser, Zoomed-in images are of white rectangle #2. c SIM imaging and 3D surface fluorescent map of representative single particles stained with LDM561, yellow dotted line in zoomed-in image #2 indicate region for fluorescence analysis. d Quantitative analysis of the area for fluorescent punctate labeled with LDM488 and LDM561. Data are mean ± SD (n = 50 areas from 10 cells). e SIM images of HepG2 cells co-stained with commercial Lipi-B405 and LDM561 channel, Zoomed-in images are of white rectangles #3, #4, #5. Three independent imaging replicates were performed, and the results were similar. f Electron microscopy imaging of single LD and multi-LD contact event. Three independent imaging replicates were performed, and the results were similar. g Schematic comparison between membrane protein ring-like LD labeling strategy and content spherical-like LD labeling strategy, suggests the traditional spherical-like labeling strategy cannot well characterize the membrane interaction event of multiple LD. LDM488 channel: λex = 488 nm, Em max 525 nm (500–550 nm); LDM561 channel: λex = 561 nm, Em max 665 nm (600–700 nm); Lipi-B405 channel: λex = 405 nm, Em max 447 nm (417–476 nm). Statistical analysis was performed using two-tailed unpaired Student’s t-test, and the data were presented as mean ± SD. P < 0.05 was considered statistically significant. Source data are provided as a source data file.

