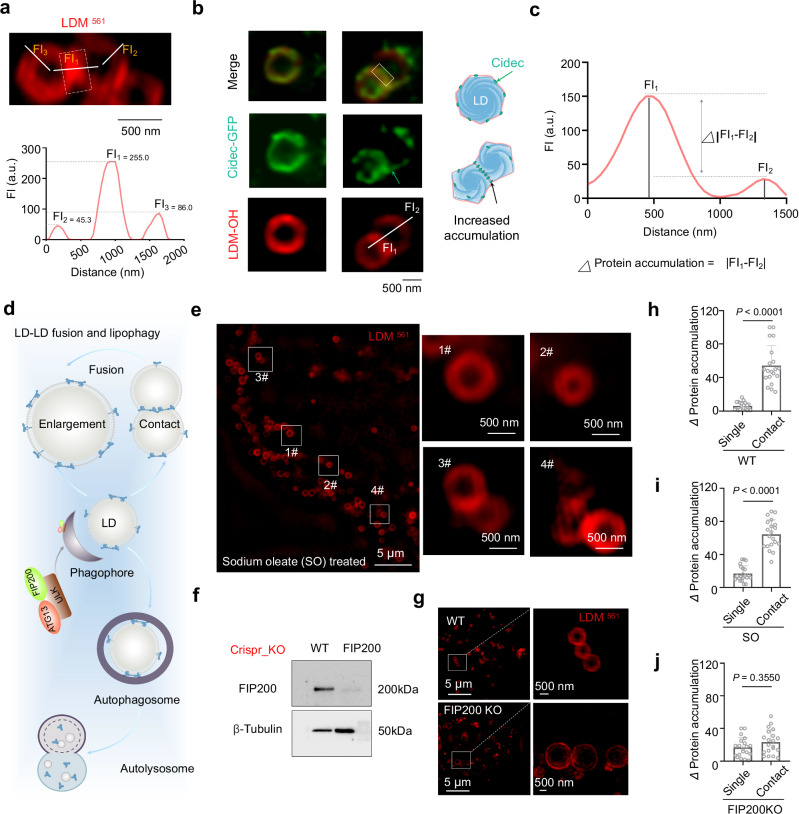
Fig. 4. LDM fluorescence aggregation as an indicator of membrane contact protein accumulation parameters.
a Representative SIM image of LD membrane dynamic stained with LDM and Lipi-B405, and simulation for single LD dynamic. b Representative SIM image of LD co-stained with Cidec-GFP in LDM-561 channel, and the schematic diagram of Cidec-GFP location in LD protein accumulation formation. Image created with Microsoft PowerPoint. c According to the LDM-OH imaging analysis of b, assuming that the protein accumulation is positively correlated with fluorescence intensity, Δprotein accumulation = |FI1-FI2 | , the data is obtained through imageJ. d Schematic diagram of LD-LD fusion and lipophilicity process, Image created with Microsoft PowerPoint. e SIM image of HepG2 cells treated with 100 μM sodium oleate, for 24 h and then stained with LDM, Zoomed-in images are of white rectangles #1-#4. white dotted line in zoomed-in images #1-#4 indicates the region for fluorescence analysis. f Western blot for detecting FIP200 protein expression in HepG2 gene-edited cells. g Representative SIM image of LD stained with LDM in HepG2 WT cells and FIP200KO cells, Zoomed-in images are of white rectangle. The white dotted line in zoomed-in images #1-#4 indicates the region for fluorescence analysis. h–j Quantitative analysis of protein accumulation changes in WT, sodium oleate and FIP200KO HepG2 cells. Data are mean ± SD (n = 20 areas from 10 cells). Cidec-GFP channel: λex = 488 nm, Em max 525 nm (500-550 nm); LDM-OH channel: λex = 561 nm, Em max 665 nm (600–700 nm). Three independent imaging or biological replicates were performed, and the results were similar. Statistical analysis was performed using two-tailed unpaired Student’s t-test, and the data were presented as mean ± SD. P < 0.05 was considered statistically significant. Source data are provided as a source data file.

