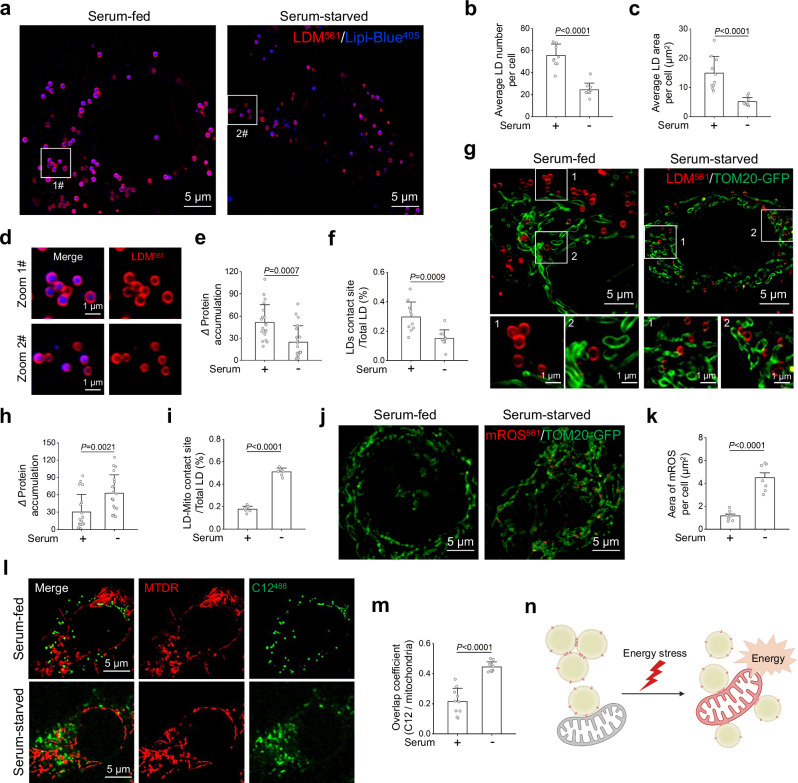
Fig. 5. Using LDM to track changes in LD membrane protein accumulation during the period of liver cancer cell starvation.
a Representative SIM images of LD changes in HepG2 cells labeled with LDM and Lipi-B405 under serum-fed and serum-starved. b, c Quantitative analysis of the number and area of LD under serum-fed and serum-starved (n = 10 cells). d Zoomed-in images are of white rectangle in a. Quantitative analysis of intermembrane LD protein accumulation and number of contact sites of LD under serum-fed and serum-starved, e n = 20 areas from 10 cells, f n = 10 areas from 5 cells. g Representative SIM images of LD and mitochondria labeled with LDM and TOM20-GFP under serum-fed and serum-starved. Quantitative analysis of LD and mitochondria protein accumulation and number of contact sites under serum-fed and serum-starved, h n = 20 areas from 10 cells, i n = 7 areas from 5 cells. j Representative SIM images of mitochondrial ROS changes labeled with mROS561 and TOM20-GFP under serum-fed and serum-starved. k Quantitative analysis of FAs and mitochondria under serum-fed and serum-starved (n = 7 cells). l Representative SIM images of FAs and mitochondria in HepG2 cells labeled with C12488 and MTDR under serum-fed and serum-starved. m Quantitative analysis of FAs co-localization with mitochondria under serum-fed and serum-starved (n = 10 cells). n Schematic diagram of the process of LD-LD separation and LD-mitochondria interaction after starvation. Created in BioRender. Shao, S. (2024) BioRender.com/e93j405. Lipi-B405 channel: λex = 405 nm, Em max 447 nm (417–476 nm); LDM-OH channel: λex = 561 nm, Em max 665 nm (600–700 nm); TOM20-GFP channel: λex = 488 nm, Em max 509 nm (505–550 nm); mROS561 channel: λex = 561 nm, Em max 610 nm (590–610 nm); MTDR channel: λex = 644 nm, Em max 665 nm; C12488 channel: λex = 488 nm, Em max 510 nm (500–510 nm). Three independent imaging replicates were performed, and the results were similar. Statistical analysis was performed using two-tailed unpaired Student’s t-test, and the data were presented as mean ± SD. P < 0.05 was considered statistically significant. Source data are provided as a source data file.

