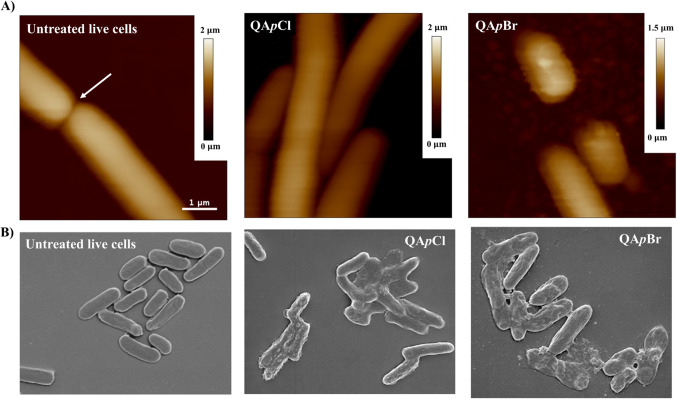
Figure 7.
Panel A: Height atomic force microscopy images before and after three-hour long treatment of Escherichia coli DH5α cells - untreated viable E. coli DH5α cells upon division (white arrow), E. coli DH5α cells after treatment with a 4 MIC concentration of QApCl and E. coli DH5α cells after treatment with a 4
 MIC concentration of QApBr. Scale bar for all AFM data is given in the first image. Panel B: Scanning electron microscopy data – untreated E. coli DH5α cells, cells treated with 16
 MIC concentration of QApCl and 8
 MIC concentration of QApBr. Scalebar corresponding to 1 μm is given below each image.

