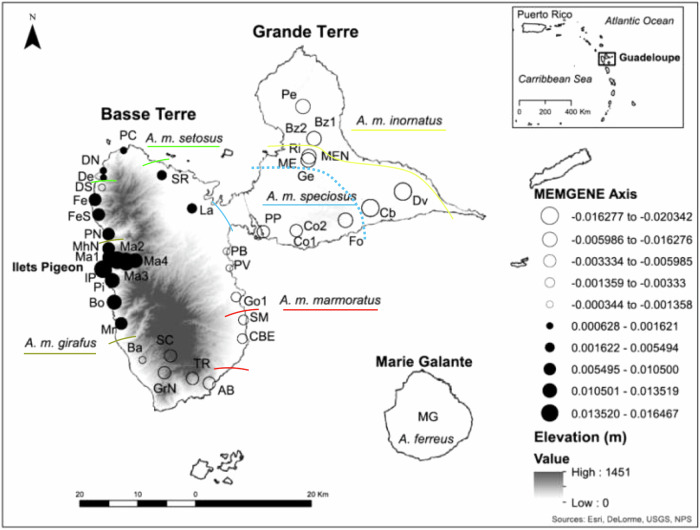
Fig. 5. Spatially explicit map of fine-scale genetic variation.
First MEMGENE axis produced by analyzing 232 samples from Basse Terre, Grande Terre, and Ilets Pigeon (Galpern et al. 2014). The individual genetic distance matrix used was estimated with the bed2diffs_v1 script from the Estimate Effective Migration Surfaces analysis (Petkova et al. 2016). MEMGENE axis values are the positive and negative eigenvector values. Circles that are the same size and color are more similar to each other. The dashed blue line shows the approximate location of the escarpment transition between mesic and xeric habitat on Grande Terre. Site abbreviations are listed in Table 1.

