
Figure 1.
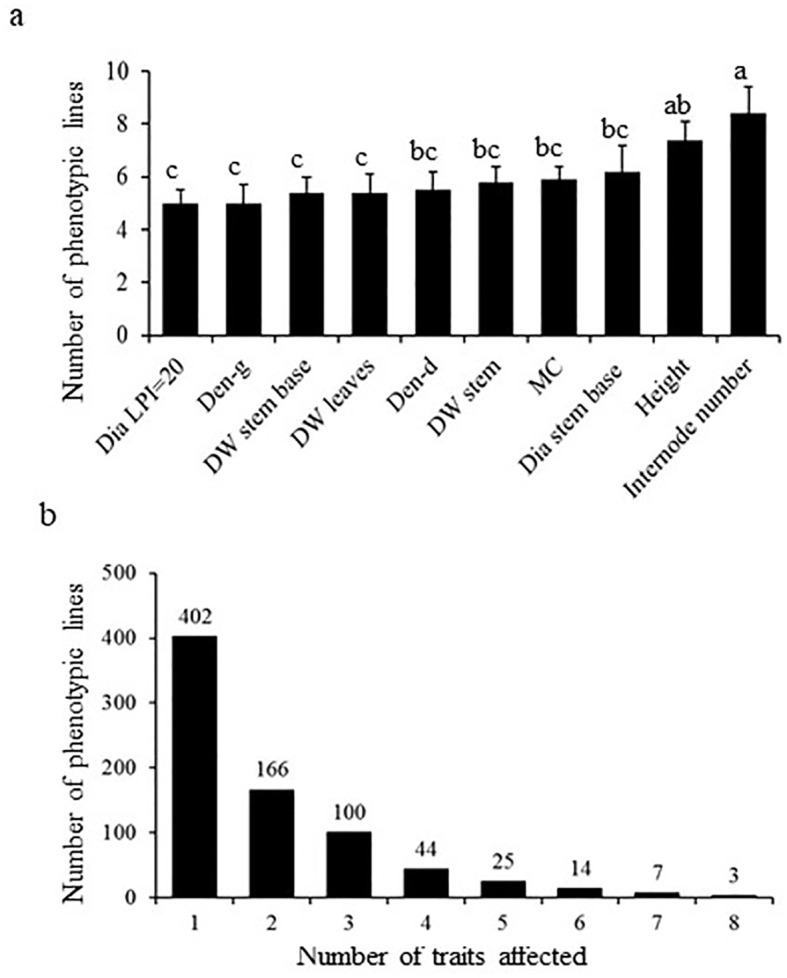
Summary of mutants and biomass traits affected in the poplar activation tagging screen. (A) Number of mutants identified to be positively and significantly affected in the various measured biomass-associated traits. Different letters indicate significance as determined by a one-way ANOVA followed by Fisher’s test (p < 0.05). (B) Illustrate the number of mutants affected in single versus multiple biomass traits.