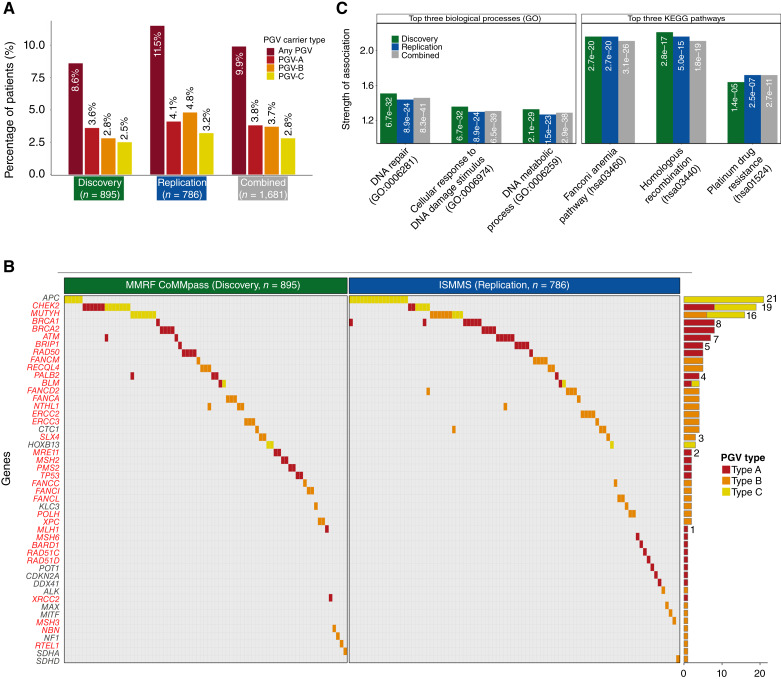
Figure 2.
Distribution and frequency of PGVs in patients with multiple myeloma. A, Prevalence of PGVs across the cohorts with multiple myeloma. B, Oncoplot detailing the distribution among the patients (columns) of PGVs in specific genes (rows). DNA repair–related gene names are denoted in red font. Adjacent is a bar plot summarizing the total PGVs detected per gene, differentiated by PGV type. C, Enriched biological pathways are shown for the gene sets carrying PGVs across the Discovery, Replication, and Combined cohorts. Left shows the top three biological processes from Gene Ontology (GO), and right displays the top three pathways from the Kyoto Encyclopedia of Genes and Genomes (KEGG). “Strength of Association” on the y-axis is obtained from the STRING protein interaction analysis and is defined as log10(observed/expected), reflecting the magnitude of enrichment for each pathway. The white text within each bar shows the FDR values for each association.

