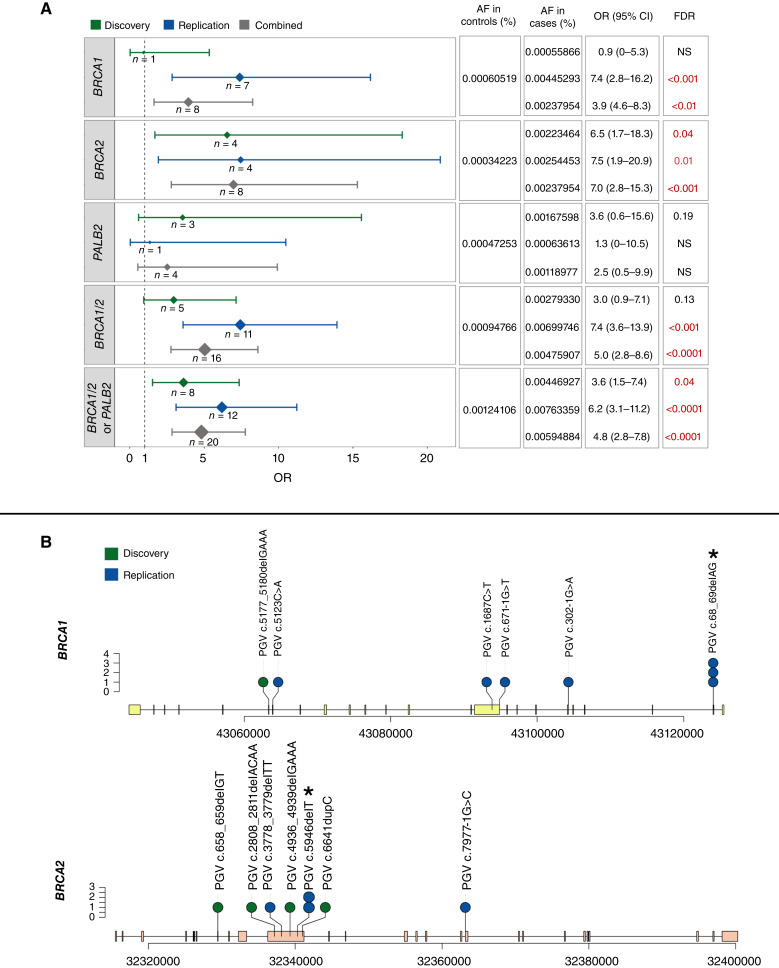
Figure 3.
Association of BRCA1, BRCA2, and PALB2 PGV-As with disease across independent cohorts with multiple myeloma. A, Forest plot displaying OR with 95% CI of PGVs in BRCA1, BRCA2, and PALB2 occurrence in Discovery, Replication, and Combined cohorts with multiple myeloma. The size of the diamond for each OR represents the case count, with larger diamonds indicating a higher number of PGVs. FDR was considered significant when <0.05. B, Lollipop plots detailing the landscape of pathogenic variants along the BRCA1 (top) and BRCA2 (bottom) genes. Each “lollipop” represents a distinct variant, with its position on the gene denoted along the x-axis and the frequency or number of observations indicated by the lollipop’s height. Asterisks (*) denotes Ashkenazi Jewish founder PGVs in these genes. AF, allele frequency; NS, nonsignificant.

