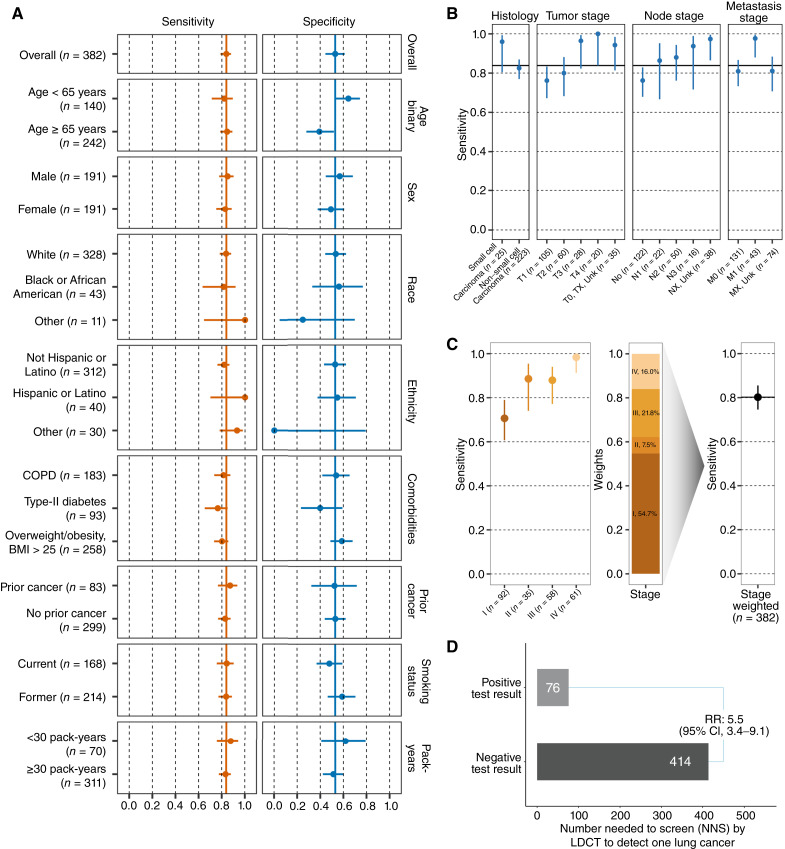
Figure 4.
Performance of blood-based lung cancer screening test. A, Sensitivity and specificity of the test in the clinical validation set (N = 382) overall and by clinical subgroup. Point estimates are reported with 95% Wilson confidence intervals. Overall sensitivity and specificity denoted by solid vertical lines. B, Sensitivity of the test in the lung cancer cases in the clinical validation set (N = 248) evaluated across cancer histology, and T, N, and M categories. Point estimates are reported with 95% Wilson confidence intervals. Overall sensitivity of 84% denoted by the solid horizontal line. C, Left, sensitivity of the test in the lung cancer cases in the clinical validation set (N = 246) by cancer group stage. Middle, bar plot showing the stage distribution of lung cancer as observed in populations undergoing lung cancer screening with LDCT (based on NLST study) that are used to weigh observed stage-specific sensitivities. Right, lung cancer screening relevant stage-weighted sensitivity in clinical validation set. D, Comparison of the NNS with LDCT conditioned on test positive or negative result when applied in the lung cancer screening eligible population. Test performance showed consistency across clinical subgroups and expected increased performance with increasing burden of disease (tumor (T), node (N), metastasis (M) and group staging). After weighting, the stage distribution to reflect a screening population, test performance remained high and demonstrated the ability to reliably identify those individuals more likely to have lung cancer detected on LDCT.

