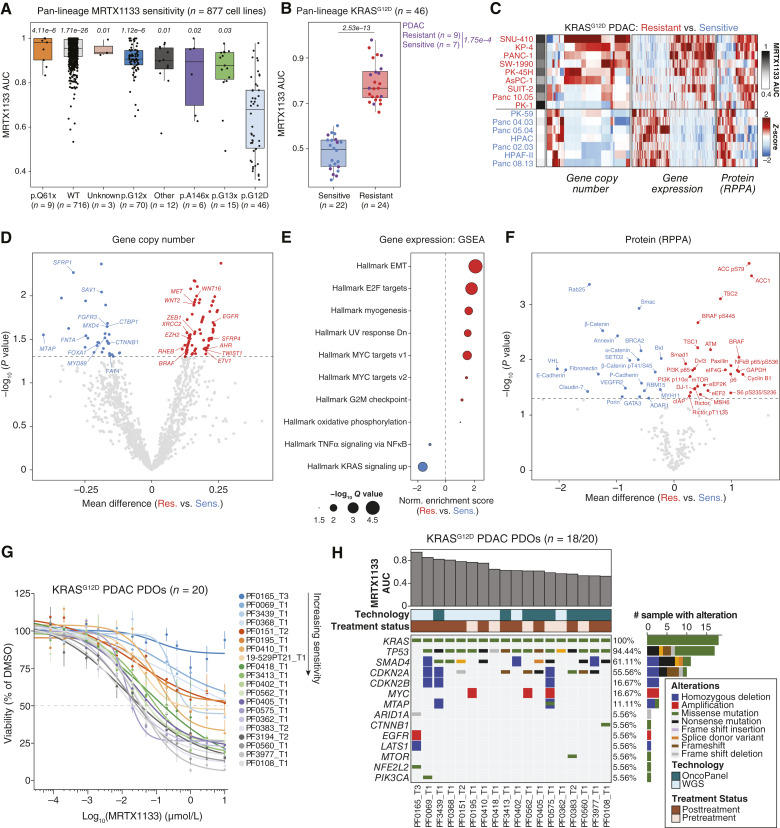
Figure 2.
Multiomic analysis identifies baseline features of response and resistance to KRASG12D inhibition. A, Boxplot representing the response to MRTX1133 plotted as the area under the dose-response curve (AUC) for 877 cell lines evaluated in the PRISM multiplex cell line screening assay. Cell lines are grouped by KRAS genotypes. AUCs were compared between each KRAS genotype relative to KRASG12D. Significance was determined via Kruskal–Wallis test followed by Dunn’s test and adjusted with Benjamini–Hochberg correction. The adjusted P value for each comparison is displayed on top of each group. B, Boxplot depicting the difference in response to MRTX1133 between subsets of resistant and sensitive KRASG12D cell lines. PDAC cell lines are colored in purple. Significance for the AUC comparison between resistant and sensitive subsets was determined by a two-sided Wilcoxon rank-sum test. C, Heatmap depicting differentially expressed features (gene copy number, gene expression, and protein levels) between MRTX1133-resistant and -sensitive KRASG12D PDAC cell lines. Each column represents a feature that is Z-scored across cell lines (rows). D, Volcano plot depicting differential gene copy number analysis between resistant and sensitive KRASG12D PDAC cell lines. The X-axis depicts the mean difference of Log2 copy number ratio calls of each protein-coding gene (relative to ploidy), between resistant and sensitive cell lines. Significance determined by two-sided Student t test. E, Hallmark transcriptional gene sets significantly enriched or depleted between resistant and sensitive KRASG12D PDAC cell lines. The normalized enrichment score from GSEA is shown on the x-axis. F, Volcano plot depicting differentially expressed proteins or phosphorylated proteins between resistant and sensitive KRASG12D PDAC cell lines. RPPA data were obtained from the Cancer Dependency Map. Significance determined by two-sided Student t test. G, MRTX1133 dose-response curves for a 6-day cell-titer-glo 3D assays with KRASG12D-mutant PDAC PDOs. PDO labels are in order of sensitivity, with lower AUC being more sensitive. Points are the mean ± SEM (n = 3 biological replicates per PDO). H, Co-mutation plot of KRASG12D-mutant PDAC PDOs displaying recurrently altered genes and selected putative drivers of baseline resistance to MRTX1133 across the cohort.

