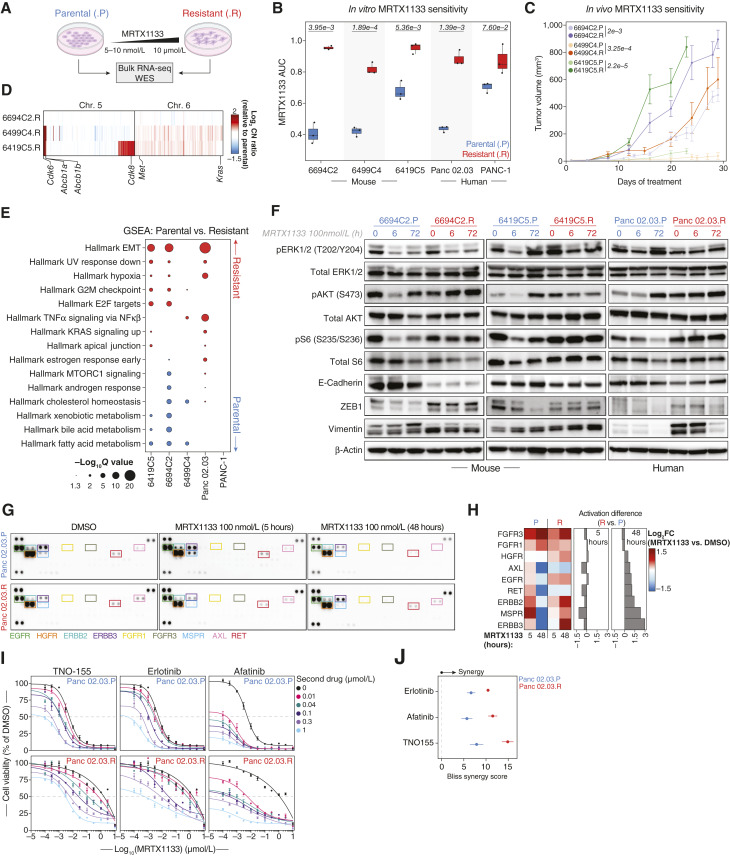
Figure 3.
CNAs, EMT, and differential RTK signaling drive acquired resistance to KRASG12D inhibition in vitro. A, Experimental workflow used to generate and characterize isogenic models of acquired resistance to MRTX1133. Parental (.P, blue) and resistant (.R, red) cell line labeling is consistent throughout this figure. B, Pairwise comparisons of the AUC for MRTX1133 between parental and derived resistant murine and human cell lines. Significance determined by two-sided Student t test (n = 3 biological replicates per cell line). The P value for each comparison is displayed at the top of each cell line pair. C, MRTX1133 treatment of syngeneic subcutaneous implant models of parental and resistant murine PDAC cell lines in C57BL6/J mice. Points are the mean ± SEM (n = 5 double-flanked mice per cell line). Significance was determined using a two-sided Wilcoxon rank-sum test on AUCs between resistant and parental cell lines. The P value for each comparison is displayed next to each cell line pair. D, Heatmap of copy number profiles at chromosomes 5 and 6, obtained from DNA WES of murine-resistant cell lines. Copy number ratios are calculated relative to each resistant cell line’s matched parental line. Genes are organized by chromosome and genomic coordinates. Amplified/gained putative drivers of resistance to MRTX1133 are labeled. E, Hallmark transcriptional gene sets significantly enriched in resistant (red) compared with matched parental (blue) human and murine cell lines. F, Immunoblots of murine and human isogenic parental/resistant cell line pairs treated with MRTX1133 (100 nmol/L) for the indicated duration. β-actin was used as protein loading control. G, Receptor tyrosine kinase (RTK) arrays of Panc 02.03 parental (.P) and resistant (.R) cell line pair, treated with DMSO or MRTX1133 (100 nmol/L) for the indicated timepoints. RTKs differentially activated across treatment conditions and cell lines are labeled. H, Left, Heatmap depicting the densitometric quantification showing RTKs differentially activated upon 5 or 48 hours of MRTX1133 treatment relative to matched DMSO-treated control. Right, bar plots depicting the relative densitometric difference for each RTK upon MRTX1133 treatment for the indicated timepoints between the resistant and the parental cell lines. Quantification is representative of two independent experiments. I, Dose-response curves based on 5-day cell-titer-glo 2.0 assays for MRTX1133 combination with RTK targeted therapies with the isogenic parental and resistant Panc 02.03 cell lines. Concentrations of the second drug are displayed on the right. TNO-155, allosteric SHP2 inhibitor; erlotinib, EGFR inhibitor; afatinib, multi-targeted inhibitor of EGFR, ERBB2/HER2, and ERBB4. Points are the mean ± SEM (n = 3 biological replicates). J, Average Bliss synergy score for combinations of MRTX1133 with RTK-directed therapies across parental and resistant Panc 02.03 cell lines. Points are the mean ± SEM (n = 3 biological replicates).

